I know I have been saying this now for a number of months, but the Seattle market has been off the charts! Instead of doing a month over month review, I wanted to take a look at the overall trends and compare how the real estate market is doing at the 2014 halfway point, comparing year-to-date residential and condominium data for 2011-2014. What I found is several areas are feeling the inventory pinch in a big way. Take a look at the summaries for the five areas I track below:
Central Seattle (Area 305)
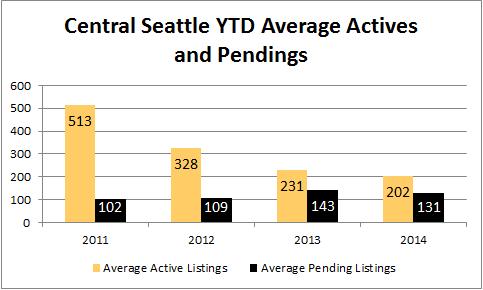
Central Seattle is feeling the inventory pinch, though not as bad as other areas. You can see our surplus of inventory in 2011 and how much it declined over 2012 and 2013. We have not seen much change between 2013 and 2014, other than the average inventory has declined by an average of about 12.5%.
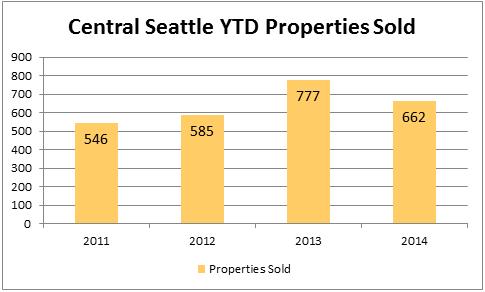
The number of solds increased dramatically in 2013 (+32.8%), but inventory challenges have caused 2014 to get off on a slower start.
Queen Anne/Magnolia (Area 700)
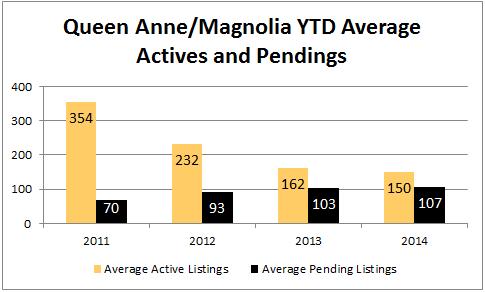
Demand for homes is strong in these areas. Again, average inventory declined between 2011 and 2012 and has stayed about the same over 2013 and 2014. Average pendings are about the same as well, but you can see how close the pendings are to the inventory which indicates that demand is high.
The number of solds over 2013 and 2014 have also been stable. These would likely be higher if more inventory was available.

Belltown/Downtown (Area 701)
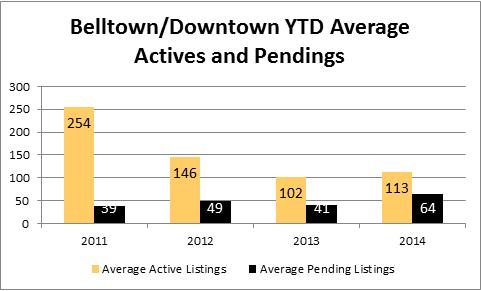
In 2011, housing demand in this area was the lowest among the five areas I evaluated, though not significantly so. This improved dramatically in 2012 but even more so in 2013 and 2014. Average inventory has improved in 2014, but only slightly. However, the average number of homes under contract have increased even more than the inventory has improved.
Accordingly, the number of sold properties has increased in 2014. However, we are not seeing a large increase in solds between 2011 through 2014 as we have in other areas.

Ballard/Greenlake (Area 705)
Wow! Inventory decreased dramatically between 2011 and 2012. 2013 and 2014 are about the same in terms of average active listings and pendings. What is interesting is the number of average pendings is higher in both years than the number of available listings. This is indicative of very high demand.
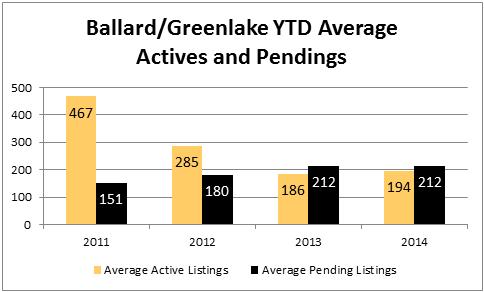
Solds are up slightly and would be even higher were there more inventory to purchase:

North Seattle (Area 710)
This is the most in-demand area at the moment with the average number of pendings the same as last year, but the average inventory has dropped 11.38% over last year. Again, we see a dramatic change between 2011 and 2012, but 2013 and 2014 have the highest demand.
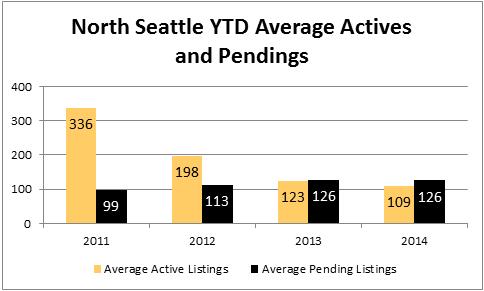
The number of solds has also increased, although this would be higher if more inventory was available.

Of the 12 listings I have at the moment, 8 of them are pending after being on the market an average of 11.88 days. What does this market mean for your real estate investment? Please give me a call at sold@windermere.com or give me a call: (206) 226-5300.


