


The cranes are busy, buyers are out shopping, and if we could get Felix Hernandez off the DL, we would really be cookin’! Let’s see what happened in Seattle’s real estate market in key neighborhoods this May.
Inventory and Pendings
Below we compare the number of active listings (supply) and pendings (demand) for several of the key Seattle neighborhoods including Central Seattle, Queen Anne and Magnolia, Belltown and Downtown, Ballard and Greenlake, and North Seattle. Our table includes single family residences as well as condos comparing May 2015 and 2016.
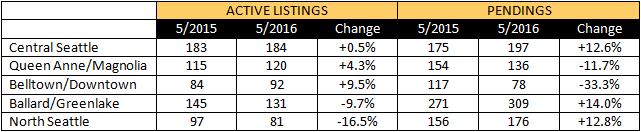
Information courtesy of NWMLS and include residences and condominiums.
We have a bit of a mixed bag when it comes to new inventory and pendings. Throughout the whole city, year-over-year inventory has dropped by 7.8% (962 properties for sale last May, 887 this May), and the number of homes under contract has increased by 6.1%.
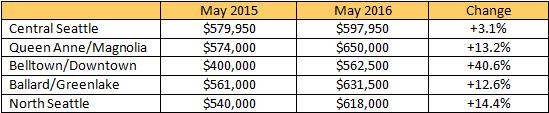
Median Sales Prices
Seattle’s median sales price for both residential and condos grew from $485,000 last May to $556,000 last month. That is a 14.6% gain. Looking at residential and condos separately, residential prices are up 13.6% ($550,000 to $625,000) and condo prices are up 10.3% ($325,000 to $358,500).
List Price to Sales Price
When the list price to sales price is over 100%, this is usually an indicator of multiple offers. For all of Seattle, last May’s list price to sales price ratio was 103.9%. This last May it was 105.7%.

Have prices increased enough to have you considering a move-up? Please contact me – your Seattle Home Guy – at sold@windermere.com or give me a call: (206) 226-5300.