Seattle housing market – slowing down??

Statistically the Seattle real estate market is still in a STRONG SELLER’S MARKET.

However, in my opinion the frenzy pace is not like it was a few months ago.

My Windermere office tracks sends out a questionnaire with every deal that is turned into my office. And one of the questions on the questionnaire is” how many offers were you competing against?” 

Here is the data from my office


Office Stats- Competitive Offers per Transaction

January   3.65 offers per transaction

February   5.9 offers per transaction

March        3.3 offers per transaction

April           3.6 offers per transaction

May           5.3 offers per transaction

June             3 offers per transaction

July            1.4 offers per transaction

August        1.6 offers per transaction


Please note that 1.6 offers per transaction in August is a GREAT NUMBER!!!  However, it is down substantially from the January through June pace.


 If you have any questions or if I can be of any assistance please contact me.

Thank you,

Steve Laevastu

cell 206-226-5300

sold@windermere.com


Seattle Rental Properties face more regulation from Seattle City Council!!!


Seattle council set to hear proposal to cap move in costs and require landords to provide payment plans


The bill is the latest in a rash of Seattle council proposals to regulate rental housing in Seattle.

Socialist Kshama Sawant is set to discuss legislation to cap ,move in costs charged by landlords to new tenants, and require that landlords provide interest free loans on deposits as demanded by the tenant.

Ordinance details include:

  • Total move-in fees (includes security deposits and non-refundable fees) restricted to no more than first month’s rent.
  • Non-refundable fees could not exceed 10% of first month’s rent.
  • Tenant’s may choose to pay move-in fees over an up-to 6-month period without imposition of any additional fees or costs.

This ordinance is in addition to the “first application requirement” that the council recently passed.

Seattle Real Estate Trends: August 2016

I am still in awe of that amazing Seahawks win on Sunday. Let’s keep it up! Go Hawks!

Let’s take a look at what happened in Seattle’s August real estate market in key neighborhoods: Continue reading

Seattle Housing Market Update

SEATTLE HOUSING MARKET UPDATE


August was another great month for SELLERS in Seattle.

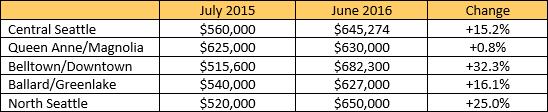
The median price of a Seattle home is now $614,000.

The median price of a Seattle home is up 10% vs August of 2015 when the median price was $560,000.


There were 880 pending sales in August, which is up 24% from twelve months ago when 710 pending sales were reported. 

SO WHAT HPPENED TO SEATTLE REAL ESTATE IN AUGUST?


In August there were 742 ACTIVE listings in the Seattle real estate market.


In August 880 homes went PENDING.


Which means that 1 out of every 0.84 homes on the market went pending in August.


This 0.84 ratio implies a 0.84 month’s supply of inventory.


The 0.84 ratio is a strong SELLER’S MARKET INDICATOR.

THE PAST 20 MONTHS HAVE SEEN THE BEST SELLER RATIOS EVER FOR SEATTLE ABSORPTON RATE.  


Any ratio under 3.0 is a seller’s market indicator.

Any ratio between 3.0 and 6.0 is a neutral market indicator.

Any ratio over 6.0 is a buyer’s market indicator.


The story remains LACK OF INVENTORY.

EPIC RECORD SETTING LOW INVENTORY!!!


In August there were 742 ACTIVE listings in Seattle.

The record low was set 8 months ago (December 2015) with 361 ACTIVE listings.


The 742 ACTIVE listings is 59% under our 10 year average for August inventory.

Another way of looking at it is that we are only at 41% of our average inventory for this time of year.


The August ten year moving average for inventory is 1,817 ACTIVE listings.


Interestingly,  if we compare August 2016 to August 2015 we will note that in August 2015 there were 704 ACTIVE listings.  In August 2016 there are 742 ACTIVE listings.  Therefore inventory is up 5% vs one year ago!!


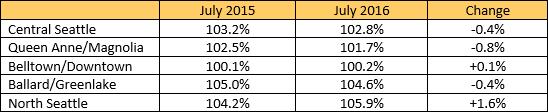
In the month of August the AVERAGE list price vs sales price for Seattle was 103%.

So the average home sold for 3% over the asking price in August!!!

This is the 19th month in a row that the AVERAGE list price vs AVERAGE sales price has been at or over 100%


The AVERAGE days on market for a Seattle home in the month of August was 17 days before they accepted an offer.  The 17 days is the 3rd lowest number ever recorded in Seattle. The record is 14 days which was set in May 2016.


And real estate is always LOCALIZED.  What I mean is that CERTAIN areas are moving better than other areas.  Let’s take a look at list price vs sales prices for some different neighborhoods in Seattle for the month of August.


  • Laurelhurst 117%
  • Bryant 110%
  • Ravenna 107%
  • Montlake 105%
  • Maple Leaf 105%
  • Green Lake 105%
  • Ballard 105%
  • Seward Park 104%
  • Wedgwood 104%
  • West Seattle 103%
  • Wallingford 103%
  • Capitol Hill 103%
  • Lake City 103%
  • Queen Anne 101%
  • Magnolia 101%
  • View Ridge and Hawthorne Hills 100%


THE CHART AND GRAPH BELOW ARE REAL ESTATE STATISTICS FOR THE CITY OF SEATTLE.

graph_sep_9th_2016


chart_sep_9th_2016


If you have any questions or if I can be of any assistance please contact me.


Thank you,


Steve Laevastu


cell 206-226-5300


sold@windermere.com


www.SeattleHomeGuy.com

Seattle Inventory Creeps Up a Bit – What Sellers Need to Know

2016-08-seattle-inventory
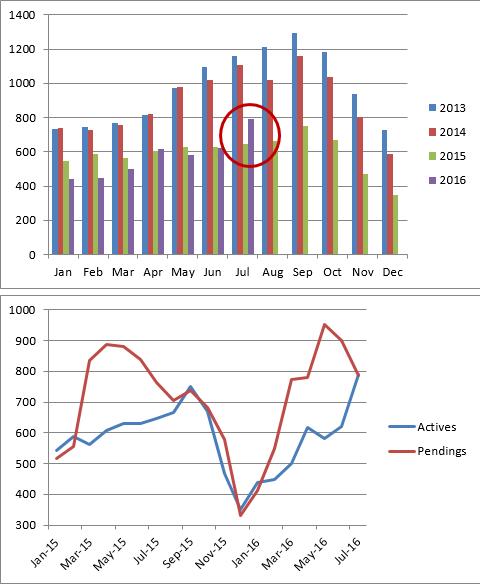
Although Seattle is still faced with higher demand than we have listings for, things changed just a little bit last month. As you can see from the chart right which shows Seattle’s inventory of single family residences, the number of homes for sale exceeded July of 2015 by more than a marginal amount.

Continue reading

Seattle Real Estate Trends: July 2016

We have had a slight increase in inventory in many neighborhoods which is much-needed.  Let’s take a look at what happened in Seattle’s July real estate market in key neighborhoods.

Inventory and Pendings

Below we compare the number of active listings (supply) and pendings (demand) for several of the key Seattle neighborhoods including Central Seattle, Queen Anne and Magnolia, Belltown and Downtown, Ballard and Greenlake, and North Seattle. Our table includes single family residences as well as condos comparing July 2015 and 2016.

2016-07-real-estate-trends-a

Overall, Seattle’s inventory of active listings increased 916 in June to 1,081 last month.  Pendings were down slightly (from 1,237 in June to 1,107 last month).

Median Sales Prices

Seattle’s median sales price for both residential and condos grew from $506,000 last July to $583,250 last month (represents a 15.3% gain). Looking at residential and condos separately, residential prices are up 14.0% ($560,000 to $638,585) and condo prices are up 12.1% ($410,000 to $459,475).

2016-07-real-estate-trends-b

List Price to Sales Price

When the list price to sales price is over 100%, this is usually an indicator of multiple offers. For all of Seattle, last July’s list price to sales price ratio was 103.4% as opposed to 104.4% this last month.

2016-07-real-estate-trends-c

I can’t believe we are only a few weeks away from the Seahawks pre-season! I am very excited! If you would like additional information on our market, please contact me – your Seattle Home Guy – at sold@windermere.com or give me a call: (206) 226-5300.

Seattle Housing Market Update – July Another Great Month For Sellers! However Is Inventory Finally Starting To Pick Up??

July was another great month for SELLERS in Seattle. However, the craziness slowed down a little bit in July.

The median price of a Seattle home is now $634,000.

The median price of a Seattle home is up 13% vs July of 2015 when the median price was $560,000.

Continue reading

Go Hawks!

If you haven’t heard, Windermere is now the Official Real Estate Company of the Seattle Seahawks. We have teamed up to #tacklehomlessness, benefiting YouthCare, a Seattle non-profit that provides services to homeless youth and has for 40 years.

Every time the Seahawks tackle an opposing player, Windermere will donate $100 to the charity.

Let’s hope for a lot of tackles in the upcoming season (can you believe the preseason is only a few short weeks away??).

Go Hawks!

Link Light Rail Affects Real Estate Prices

It can be tough to get around in Seattle and on the Eastside. As we add hundreds of people per week to our expanding city, and even more to the whole area, the problem is not going to go away anytime soon. More-flexible work schedules and people working from home will certainly help, but in the coming years, as Link light rail expands, the value of properties around those light rail stops were expected to go up. But now there is a study that substantiates that!

Continue reading

Seattle Real Estate Trends: June 2016

Summer is beautiful in the Pacific Northwest and although we have had a rainy start to summer 2016, I have high hopes that the sun will come out and smile on Seattle in the coming weeks. Is this a weather prediction or just my joy at seeing that Felix is coming off the disabled list? We shall see! Let’s take a look at what happened in Seattle’s real estate market in key neighborhoods this past June: Continue reading