Could Rent Control be coming to Seattle?

According to the National Association of REALTORS®, over the last five years in the Seattle Metro area, rents have increased a whopping 22.26% between whereas wages for 25-44 year olds (which comprise a good number of renters) only increased 15.3%. This time period reviewed was quarter 3 2009 to quarter 3 2014 for the rents whereas wages were reviewed 2009-2014. According to Dupre+Scott Apartment Advisors, that number is even more staggering when looking only at Seattle and since spring of 2013 – 18% higher.

This disparity along with comparisons to tech-driven job markets such as San Francisco have many wondering if Seattle could be the next city to jump on the rent control bandwagon.

According to the Puget Sound Business Journal, there was a town meeting at City Hall on April 23rd to discuss this hot topic and Mayor Ed Murray has even created a housing affordability task force to tackle the problem. The hurdle is a big one – rent control is currently illegal in Washington State.

Seattle Magazine reports that renters make up 52% of Seattle’s population, so the effects of such a law – or not passing a law – will be felt by the majority of Seattle’s residents. With the average market rent for a one bedroom, one bathroom apartment in the city of Seattle going for $1,445 per month, there are a number of renters and would-be renters who are going to have to start finding housing further away from the city center.

People for rent control point to issues like transportation that become a bigger challenge when workers cannot afford to live near where they work and have to commute in. However, those who oppose it indicate that rent control will hamper development and reinvestment in the buildings that may be in need of updating.

Whether you are a proponent of rent control or not, this debate and rent increases are driving some to turn to home ownership, even with the inventory shortages that challenging the real estate market.

However, the economics of it make sense. If you are paying $3,000 per month for a three bedroom apartment in Capitol Hill and you can buy a 3 bedroom home in Wallingford for $600,000 (even taking into account multiple offers driving up the price from $500,000 to $600,000), depending on your down payment, that mortgage and principle may only come to $2,300 per month. Add taxes and insurance on there and you might be at $2,800 per month.  Remember, this is just an estimation, and prices vary, but if you are pounding your fist, hoping rent control is passed before your landlord decides to raise the rent again, you owe it to yourself to take a look at home ownership.

And remember! If you have a 30 year fixed rate mortgage, your monthly mortgage payment is your monthly mortgage payment – next year and 25 years down the road. Furthermore, you are building equity which could mean money in your pocket when you are ready to sell. Try doing that while renting!

I would be happy to give you additional information on how to make your housing dollars go further. Give me a call: (206) 226-5300 or send an email to: sold@windermere.com!

Amazon Set to Lease More Office Space in Downtown Seattle

According to the Seattle Times, Amazon has leased a full city block in South Lake Union which was originally occupied by Troy Block. This is a two building development with 817,000 total square footage leased. The first of these two buildings will be open in 2016 and the other in 2017. The total square footage occupied by Amazon could accommodate 50,000 employees which would make Amazon the largest employer in Seattle.

While there are some concerns about Amazon occupying 25% of Seattle’s available inventory of premium office space, I would like to focus on what this could mean for our local real estate market.

As you probably are aware, we have a shortage of available homes in our Seattle real estate market. There is a shortage of condos, residences, and rentals causing rental rates to increase excessively. There are some apartment buildings in the area that are renting apartments in excess of $4,000 per month for a two bedroom apartment just over 1,000 square feet. The City of Seattle and King County have turned density and growth into hot, highly debatable, topics. Unless we allow for areas of higher density, house prices are going to continue to rise, causing would-be workers to be priced out of the urban core due to high rents or housing prices.

The second hot topic is transportation. Sound Transit and Light Rail are going to be a part of our long-term solution for dealing with the increase in traffic that more jobs in the Downtown core creates. Although I mentioned Amazon earlier, Facebook is also expanding Downtown according to Geekwire, along with Zillow, Twitter, Tableau, and Google which means more employees at these companies as well.

What do homeowners and would-be homeowners need to know? If you are renting, please talk to a real estate agent about what the next five years could look like for you in terms of rent versus your purchasing a home or a condo. There may be loan programs available that will allow you to purchase property with a lower down payment than you expected.

I will be keeping an eye on what Seattle and King County are doing to handle the density problem which could affect homeowners in our area. In other cities where additional dwellings are allowed on a city lot, the value of those lots have gone up significantly. I will be sure to keep you in the loop if something like that comes to the Seattle real estate market! In the meantime, please contact me with any questions you have about our local housing market: (206) 226-5300 or email sold@windermere.com.

Seattle February Housing Market Stats – Historic Seller’s Market Continues!!

SEATTLE HOUSING MARKET UPDATE


The February real estate market continued to remain extremely hot for sellers!!

The new report summarizing February activity shows year-over-year gains in pending sales, and prices.

The median price of a Seattle home is now $490,000 which is up 9% from one year ago when the median price of a Seattle home was $450,000.

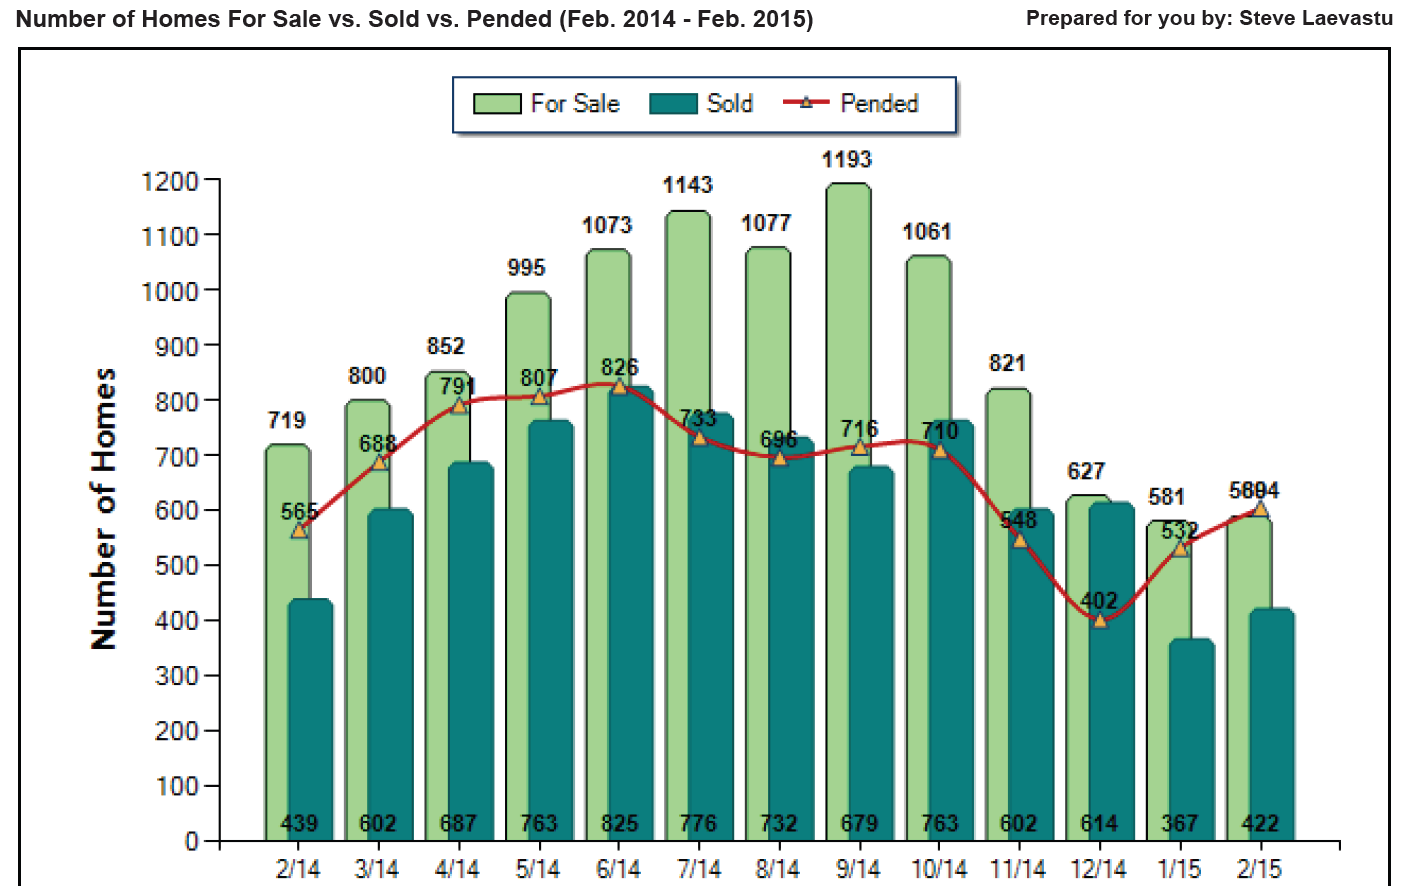
There were 604 pending sales in February, which is up 7% from twelve months ago when 565 pending sales were reported.


SO WHAT HAPPENED TO SEATTLE REAL ESTATE IN FEBRUARY?

In February there were 589 ACTIVE listings in the Seattle real estate market.

In February 604 homes went PENDING.

Which means that 1 out of every 0.975 homes on the market went pending in February.

This 0.975 ratio implies a 0.975  month supply of inventory.

The 0.975 ratio is a strong SELLER’S MARKET INDICATOR.

The 0.975 ratio for Seattle is the BEST RATIO I HAVE EVER SEEN IN MY 28 YEARS AS A REALTOR.

It is slightly better than last month’s ratio of 1.02


Any ratio under 3.0 is a seller’s market indicator.

Any ratio between 3.0 and 6.0 is a neutral market indicator.

Any ratio over 6.0 is a buyer’s market indicator.


The story remains LACK OF INVENTORY.

In February there were 589 ACTIVE listings in Seattle.

The 589 ACTIVE listings is 62% under our 10 year average for February inventory.

THE 589 ACTIVE listings is the 2nd lowest month ever.  Slightly higher than the all time low which was set last month (January 2015) with 581.

The February ten year moving average for inventory is 1,554 ACTIVE listings.

Also if we compare February 2015 to February 2014 we will note that even though inventory was low in February 2014 (719) it was even lower in February 2015 (589). Inventory is down 18% vs 2015.

In the month of February the AVERAGE list price vs sales price for Seattle was 101%.

So the average home sold for 1% over the asking price.


Please see the graphs and charts below

Graph_March_9th_2015


Chart_March_9th_2015


If you have any questions or if I can be of any assistance please contact me.


Thank you,

Steve Laevastu

cell 206-226-5300


sold@windermere.com


Seattle January 2015 – STATISTICALLY BEST MONTH EVER IN SEATTLE REAL ESTATE HISTORY!!!

SEATTLE HOUSING MARKET UPDATE

The January real estate market continued to remain extremely hot for sellers!!

The new report summarizing January activity shows year-over-year gains in pending sales, and prices.

The median price of a Seattle home is now $500,000 which is up 16% from one year ago when the median price of a Seattle home was $432,000.   HOWEVER, THE 16% JUMP IN PRICE MIGHT BE AN ANOMALY DUE TO ONLY 342 CLOSINGS IN JANUARY.

Because if we look at the data differently and compare the Seattle median sales price in 2014 of $478,000 to the Seattle median sales price so far in 2015 of $499,496 therefore I think the 16% jump is an anomaly.

MEDIAN SEATTLE JANUARY HOME PRICE PAST 10 YEARS

2005 = $390,000

2006 = $439,500

2007 = $459,950

2008 = $430,000

2009 = $391,000

2010 = $399,000

2011 = $365,000

2012 = $399,500

2013 = $444,599

2014 = $478,000

2015 = $499,496


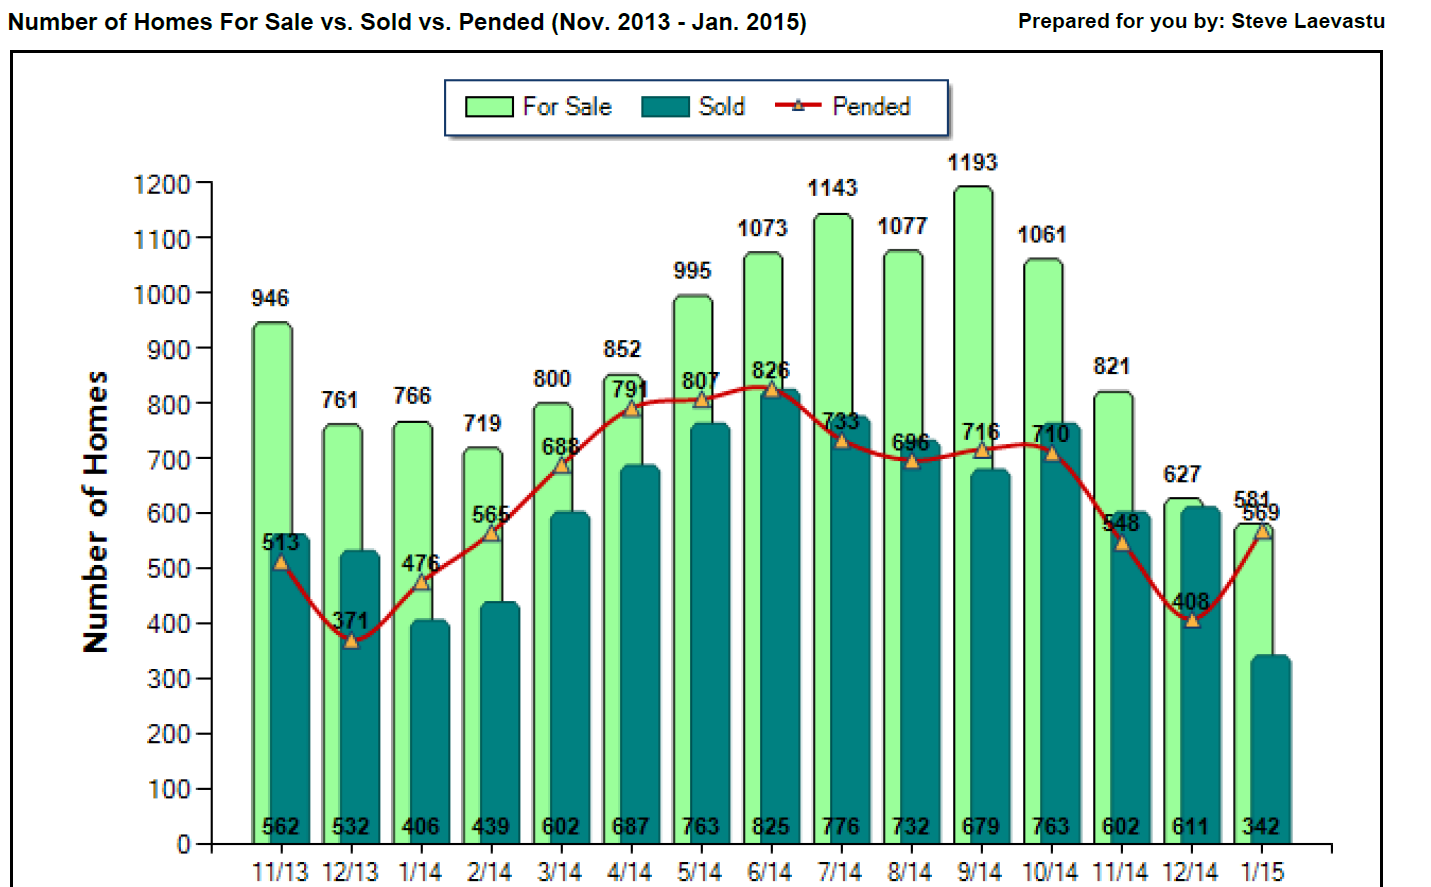
There were 569 pending sales in January, which is up 17% from twelve months ago when 476 pending sales were reported.


SO WHAT HAPPENED TO SEATTLE REAL ESTATE IN JANUARY?

In January there were 581 ACTIVE listings in the Seattle real estate market.

THIS IS THE LOWEST NUMBER OF ACTIVE LISTINGS THAT I HAVE EVER SEEN IN SEATTLE REAL ESTATE IN MY 28 YEARS IN THE BUSINESS!!!

In January 569 homes went PENDING.

Which means that 1 out of every 1.02 homes on the market went pending in January.

This 1.02 ratio implies a 1.02 month supply of inventory.

The 1.02 ratio is a strong SELLER’S MARKET INDICATOR.

The 1.02 ratio for Seattle is the BEST RATIO I HAVE EVER SEEN IN MY 28 YEARS AS A REALTOR.


Any ratio under 3.0 is a seller’s market indicator.

Any ratio between 3.0 and 6.0 is a neutral market indicator.

Any ratio over 6.0 is a buyer’s market indicator.


The story remains LACK OF INVENTORY.

HISTORIC ALL TIME RECORD LOW INVENTORY FOR SEATTLE!!

The 581 ACTIVE listings is 61% under our 10 year average for January inventory.

The January ten year moving average for inventory is 1,465 ACTIVE listings.

Also if we compare January 2015 to January 2014 we will note that even though inventory was low in January 2014 (719) it was even lower in January 2015 (581). Inventory is down 24% vs 2015.

In the month of January the list price vs sales price was 100%.


WHAT TO EXPECT IN FEBRUARY?

Inventory always bottoms out in Seattle on December 31st.  And new inventory starts to hit the market on January 1st.  HOWEVER, THE FIRST 5 WEEKS OF 2015 VERY LITTLE NEW INVENTORY HAS BEEN HITTING THE MARKET.  I expect February inventory to increase slightly from the RECORD LOW INVENTORY OF 581 ACTIVE LISTINGS.

And because buyers still have very little to choose from I expect the pending units for January to come in around 550.

The past 6 months have had INVENTORY/PENDING ratios of 1.0 to 1.7 (a strong seller’s market) therefore I expect February to be the same since no leading indicator/parameter has really changed much over the past few months.

  • Inventory remains historically low
  • The Seattle economy is very strong with unemployment of approximately 4%
  • Interest rates remain outstanding with fixed 30 year mortgages hovering slightly below 4%

So expect February to be another great month for sellers with an inventory/pendings ratio of 1.0 to 1.7

And with the market being so out of equilibrium I expect the AVERAGE SALES PRICE TO LIST PRICE RATIO TO BE OVER 100%.  I think it will come in at 101%


If you have any questions or concerns please feel free to contact Steve Laevastu 206-226-5300 sold@windermere.com


Please see the graphs and charts below

Graph_Feb_8_2015Chart_Feb_8_2015


If you have any questions or if I can be of any assistance please contact me.


Thank you,


Steve Laevastu

cell 206-226-5300

sold@windermere.com

www.SeattleHomeGuy.com

Shopping for a home – and a Parking Spot – in Seattle

Although many homes in Seattle come equipped with a garage and driveway, there are many homes in the older neighborhoods which are not so lucky, leaving neighbors vying for coveted curb space. Additionally, if you are a couple purchasing a condo in the Downtown area, the condo may come with a parking spot in the garage for a single vehicle, but perhaps not two. Therefore if you are buying in Seattle, thinking about what you are going to do about parking if your home or condo doesn’t come with enough spots to park your car is something that should indeed be on your mind.

We have forces working both for the parking-challenged and against them at the moment. With more micro-housing being built in Downtown which attracts Millennials who may be more likely to take advantage of public transportation, the parking problem may be alleviated in some areas. However, with more people moving to Seattle, that is going to make the overall problem a bigger challenge.

In neighborhoods where neighbors vy for street parking in front of their own house, the introduction of a neighbor with yet another car to park can be a challenge. It is important to remember that no one owns the parking spots on the street and while it is courteous to allow people to park in front of their own homes, it is not the law, so don’t assume that if you purchase a home, the spot on the street is yours.

I have seen extra parking spots in condo complexes go for $15,000 and up, making this a large expense in addition to the property you may be purchasing – if there is one available.

My advice? Make sure you don’t overlook this critical component in buying a home or condo in Seattle. Make a plan if the home you are making an offer on doesn’t include parking. Contact me to learn more! Steve Laevastu: sold@windermere.com or give me a call: (206)-226-5300

Urban Growth in Seattle

As we bid farewell to 2014, we can look forward to a continued strong real estate market in Seattle in 2015, driven by not only our strong economy, but also the influx of people wanting to live in the city.

In terms of the job market, Seattle Bellevue Everett Metropolitan Statistical Area unemployment rate is currently at 4.5%, below our ten-year average of 6.1%. In addition to growth in the number of jobs in our area, we are also seeing growth in wages due to the types of jobs we have been adding at companies such as Microsoft, Amazon, and Boeing.  However, retail and construction also had positive growth in the past year.

These companies are attracting young, skilled Millennial workers to our city’s core where companies like Amazon have set up shop. In an interview with Jeff Bezos, he indicated that an urban setting set the stage for the type of culture he sought for the company. NBBJ chairman (an architecture firm), Scott Wyatt, pointed to several reasons why this model works: Urban Seattle is growing faster than the suburbs, people want activities close by and don’t necessarily want to own a vehicle, companies want to foster a collaborative environment with not only employees from their own company, but other companies as well, and an urban setting allows for more physical movement. It is clear that if the Amazon model works, we will continue to see growth in the tech sector in the urban core.

We don’t currently have enough housing to keep up with the housing demand in the urban core, which is why rent rates are increasing at the pace they are as well as median home prices. I expect this will continue to be an issue in 2015 as our city amplifies its efforts to keep up with demand.

For example, according to the Seattle Times, there is a new skyscraper coming to town – a tower to replace the current Rainier Square shopping mall which will include eight stories of luxury apartments as well as 35 floors of offices and ground-floor retail. It sits between Fourth and Fifth avenues and Union and University streets on the site of the original University of Washington. This will be the second-highest skyscraper in the city, behind the Columbia Tower. However, this is still in the planning stages and will not be completed for several years.

These factors point to investment appreciation if you own real estate in Seattle. Our market is strong and all signs point to a robust 2015. Give me a call to learn more: Steve Laevastu: 206-226-5300 or sold@windermere.com.

Sources:

Urban Land Institute Names Seattle in Top 10 Markets to Watch in 2015

Urban Land Institute has released their “Emerging Trends in Real Estate” report for 2015 and the news for Seattle is favorable!

The Institute points to the principle of the “24-hour city” which needs to be adopted by urban areas in order to have a thriving downtown. They note that downtown transformations need to combine “housing, retail, dining and walk to work offices to regenerate urban cores” in order to increase investment for single family and multi-family housing. While most of the emerging, revitalized urban centers aren’t true 24-hour cities, they have certainly expanded from 9-5 town into “18-hour markets”. According to the report, investors are attracted to markets with “vibrant urban centers”. Some of Seattle’s most vibrant neighborhoods fit this bill.

In the report, the Urban Land Institute points to different Markets to Watch in 2015. The basis for these being markets to watch is the demand for “desired assets” which is expected to drive prices up and returns down and subsequently the need for alternative investment options which yield higher returns. One strategy noted for this in the report was the potential for investors to look at markets close to a major metropolitan area.

Seattle ranked 8th on the list overall which measures investment, development, and home building potential in 2015. Portland, Oregon ranked 16th and Tacoma ranked 62nd (this is the first year Tacoma has been measured as a separate entity outside of Seattle).

Another factor that was examined was population growth. Between 2010-2013, the urban population growth in Seattle rose 6.9% to 2.88 million people which also helped its placement in the “good market” category.

Technology is a local driver of employment in Seattle and the millennial generation is flocking in to take those jobs. It is a “top capital destination” which attracts institutional and local investors.

The report predicted that the job market in Seattle will expand 2.6% in 2014-2015.

We have a lot to be thankful for in Seattle this Thanksgiving. A robust job market, strong population growth, and of course, we live in the most beautiful place in the country! Happy Thanksgiving to you!

Seattle Real Estate Trends, October 2014

SEATTLE HOUSING MARKET UPDATE


October was another great for month for sellers in Seattle.

The new report summarizing October activity shows year-over-year gains in pending sales, and prices.

The median price of a Seattle home is now $495,000 which is up 7% from one year ago when the median price of a Seattle home was $461,000.

There were 754 pending sales last month, which is up 10% from twelve months ago when 685 pending sales were reported.


SO WHAT HAPPENED TO SEATTLE REAL ESTATE IN OCTOBER?

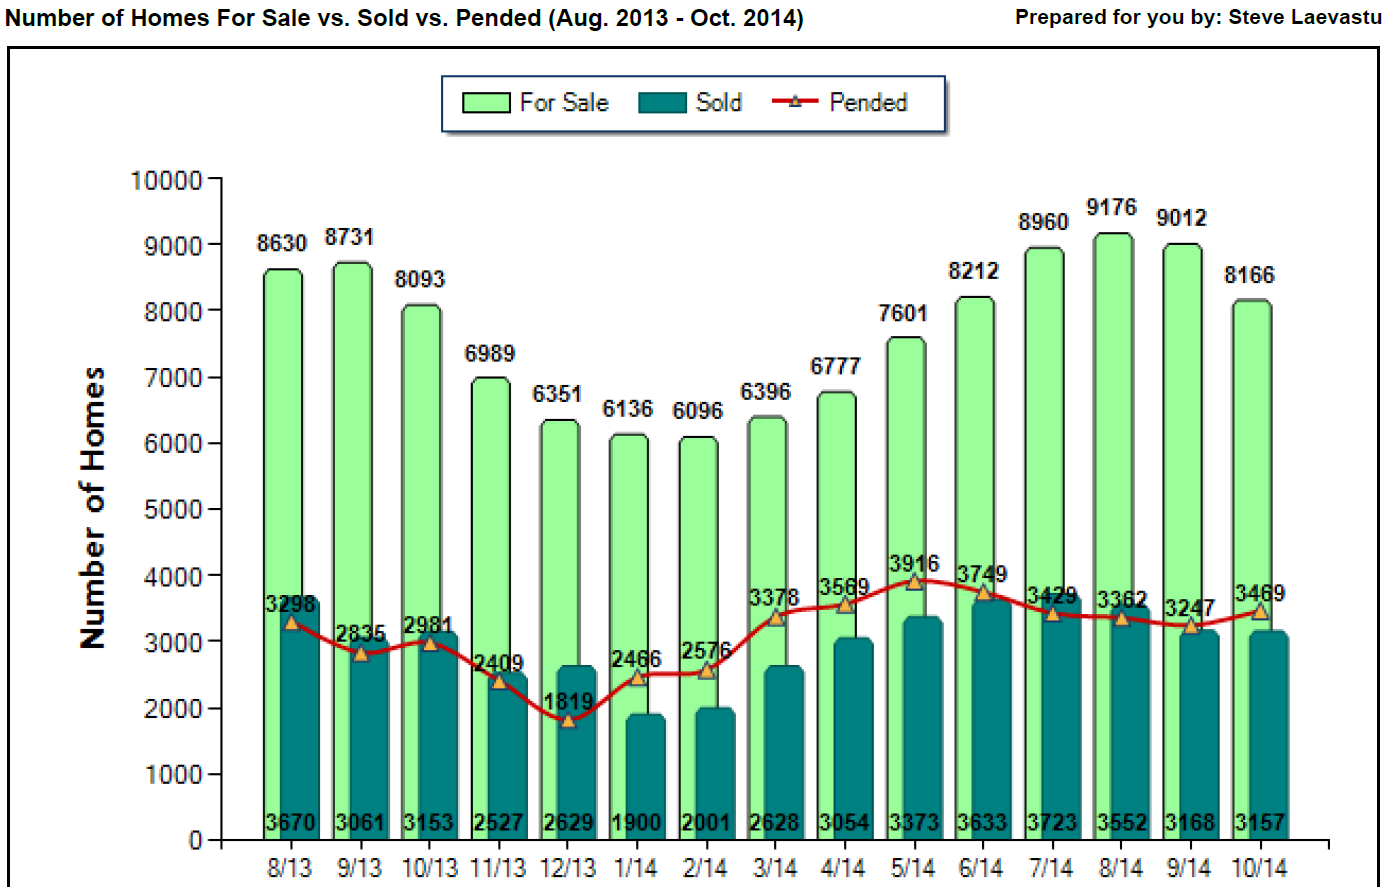
In October there were 1,061 ACTIVE listings in the Seattle real estate market.

In October 754 homes went PENDING.

Which means that 1 out of every 1.4 homes on the market went pending in October.

This 1.4 ratio implies a 1.4 month supply of inventory.

The 1.4 ratio is a strong SELLER’S MARKET INDICATOR.


Any ratio under 3.0 is a seller’s market indicator.

Any ratio between 3.0 and 6.0 is a neutral market indicator.

Any ratio over 6.0 is a buyer’s market indicator.


The story remains LACK OF INVENTORY.

The 1,061 ACTIVE listings is 48% under our 10 year average for October inventory. 

The October ten year moving average for inventory is 2,049 ACTIVE listings.

Also if we compare October 2014 to October 2013 we will note that even though inventory was low in October 2013 (1,230) it was even lower in October 2014 (1,061). Inventory is down 14% vs 2013.

Also please note that October was the 9th month in a row that the AVERAGE list price vs SALES price was 100% or more.

In the month of October the list price vs sales price was 100%.


WHAT TO EXPECT IN NOVEMBER?


Historically INVENTORY peaks in the Seattle market in September and starts to come down in October, November and December.  So you can expect inventory to decrease from the current level of 1,061.  So there will be LESS TO CHOOSE FROM FOR BUYERS.

And because buyers will have less to choose from therefore I expect sales to slow from the 754 PENDING that we saw in October and expect the number of pendings in November to be somewhere in the  high 600’s.

The past 4 months have had INVENTORY/PENDING ratios of 1.4 to 1.7 (a strong seller’s market) therefore I expect November to be the same since no leading indicator/parameter has really changed much over the past few months.

  • Inventory remains historically low
  • The Seattle economy is very strong with unemployment of approximately 4%
  • Interest rates remain outstanding with fixed 30 year mortgages hovering around 4% USUALLY, I advise my sellers to wait until January to put their homes on the market rather than put their home on the market in November because USUALLY the Seattle real estate market slows down about a week before Thanksgiving and stay slow until about a week after New Year. HOWEVER, this year I advise my sellers to put their homes on the market now because the market remains VERY ACTIVE with historically low inventory and strong pent up demand.  In 2012 and 2013 we had VERY STRONG NOVEMBER AND DECEMBER markets in Seattle.

November 2012        1 out of every 1.6 homes went sold pending

November 2013        1 out of every 1.5 homes went sold pending

December 2012        1 out of every 1.7 homes went sold pending

December 2013        1 out of every 1.4 homes went sold pending


If you have any questions or concerns please feel free to contact Steve Laevastu 206-226-5300 sold@windermere.com


Please see the graphs and charts below


Graph_November_2014


Chart_November_2014


If you have any questions or if I can be of any assistance please contact

Steve Laevastu

cell 206-226-5300

sold@windermere.com


Seattle Housing Market Update – September 2014 Median House Price 2nd Highest Of All Time

SEATTLE HOUSING MARKET UPDATE


September was another great for month for sellers in Seattle.

The median price of a Seattle home was back up to $500,000 after showing lots of fluctuation over the past 2 months:

  • July 2014 median price $525,000
  • August 2014 median price $475,000
  • September 2014 median price $500,000

I think the July 2014 of $525,000 and the August 2014 of $475,000 are BOTH anomalies/outliers and that the $500,000 in September is a true reading.

The September 2014 median sales price of $500,000 is the 2nd ALL TIME HIGHEST MEDIAN SALES PRICE EVER RECORDED.  The record is July 2014 with the median price of $525,000.


SO WHAT HAPPENED TO SEATTLE REAL ESTATE IN SEPTEMBER?

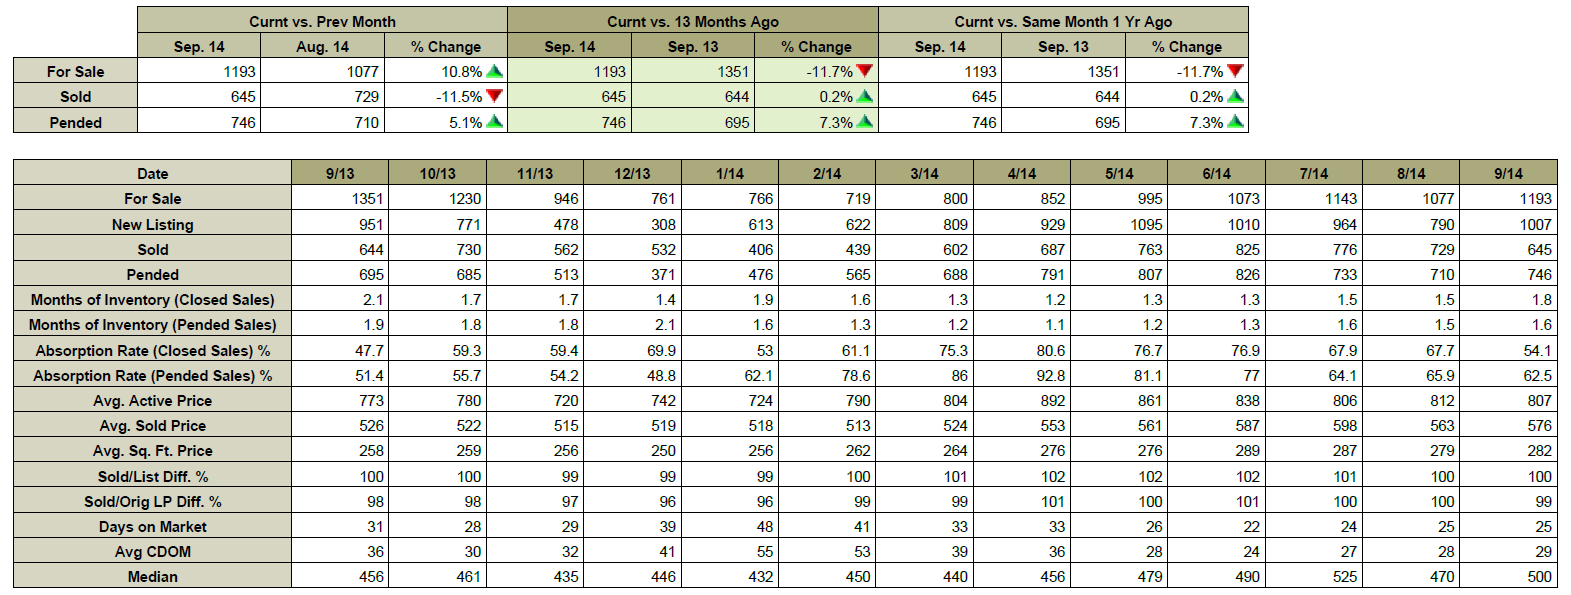
In September there were 1,193 ACTIVE listings in the Seattle real estate market.

In September 746 homes went PENDING.

Which means that 1 out of every 1.6 homes on the market went pending in September.

This 1.6 ratio implies a 1.6 month supply of inventory.

The 1.6 ratio is a strong SELLER’S MARKET INDICATOR.


Any ratio under 3.0 is a seller’s market indicator.

Any ratio between 3.0 and 6.0 is a neutral market indicator.

Any ratio over 6.0 is a buyer’s market indicator.


The story remains LACK OF INVENTORY.

The 1,193 ACTIVE listings is 44% under our 10 year average for September inventory. 

The September ten year moving average for inventory is 2,115 ACTIVE listings.


Also if we compare September 2014 to September 2013 we will note that even though inventory was low in September 2013 (1,351) it was even lower in September 2014 (1,193). Inventory is down 12% vs 2013.


And if we compare DEMAND.  In September 2013  695 homes went PENDING and in September 2014  746 homes went PENDING.  So DEMAND was 7% higher in 2014.


Also please note that September was the 8th month in a row that the AVERAGE list price vs SALES price was 100% or more.

In the month of September the list price vs sales price was 100%. 


WHAT TO EXPECT IN OCTOBER?


Historically INVENTORY peaks in the Seattle market in September and starts to come down in October.  So you can expect inventory to decrease from the current level of 1,193.  So there will be LESS TO CHOOSE FROM FOR BUYERS.


And because buyers will have less to choose from therefore I expect sales to slow from the 746 PENDING that we saw in September and expect the number of pendings in October to be somewhere in the 600’s.


The past 3 months have had INVENTORY/PENDING ratios of 1.5 to 1.6 (a strong seller’s market) therefore I expect October to be the same since no leading indicator/parameter has really changed much over the past few months.

  • Inventory remains historically low
  • The Seattle economy is very strong with unemployment of approximately 4%
  • Interest rates remain outstanding with fixed 30 year mortgages hovering around 4%

So expect October to be another great month for sellers with a inventory/pendings ratio of 1.5 to 1.6


If you have any questions or concerns please feel free to contact Steve Laevastu 206-226-5300 sold@windermere.com


Please see the graphs and charts below

Graph_Oct_2014


Chart_October_2014


If you have any questions or if Steve Laevastu can be of any assistance please contact me


Thank you,

Steve Laevastu

cell 206-226-5300

sold@windermere.com


Seattle Real Estate Trends – By The Numbers

The Seattle Area by the Numbers

#1 Apartment Rent Growth in US  The Census Bureau reports median apartment rents have soared 11% between 2010 and 2013 and rents in downtown Bellevue are now higher than San Francisco.

#2 Technology Growth in US  Jones Lang LaSalle reports the metro area now employs more than 120,000 high-tech workers, second only to San Francisco.

#3 Lowest Unemployment in US  Seattle area dropped to 4.8%, its lowest level since August 2008 and third lowest of major metro areas in the US.

#4 Tightest Office Market in US  Since 2010, the Seattle and Bellevue commercial markets witnessed 9.4 million sq. ft. of occupancy gains with 1.7 million sq. ft. currently under construction, resulting in just 11.5% vacancy.

Washington’s Population Growth Nears 7 Million The Office of Financial Management reports the highest annual gains since 2008 with the majority relocating to the Central Puget Sound region.

Forbes Ranks Seattle #2 “Coolest City” in US Populous cities ranked on arts, culture, recreation, diversity, local eateries and youthful population.

Bellevue Ranked #2 “America’s Best Cities to Live” 24/7 Wall St. reviewed data on 550 US cities based on crime, employment, education and housing.

Seattle “Top 10” Relocation Market in US  Ranked #7, Money says new residents are drawn by strong job growth, especially in high tech segments making it also among the “Best Real Estate Markets in the US for 2014”, according to the Urban Land Institute.

Seattle “Smartest City in North America” With high quality schools and an ability to attract creative and entrepreneurial talent, Seattle earned Fast Company’s top ranking.