Usually we see Seattle real estate take a small breather in July. Not so this year. Although Seattle’s inventory has increased since its low point in January of 830, it has only increased 16.2% to 982 properties for sale in July. The number of homes under contract did decrease a bit to 1,122 from the high this year of 1,270 in May.
Here is a closer look at what is happening in the Seattle real estate market and trends for some its key neighborhoods:
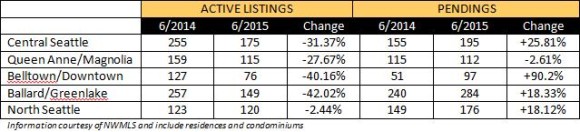
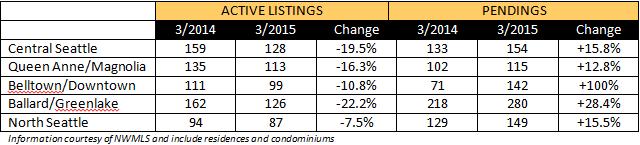
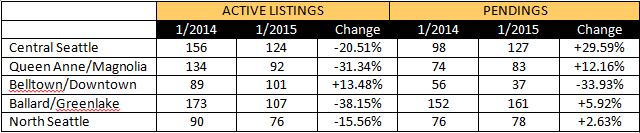
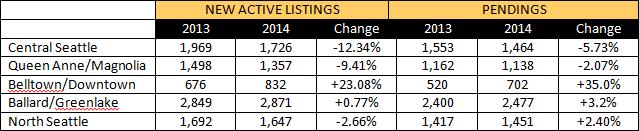
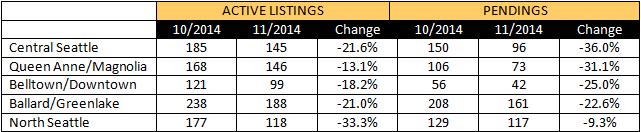
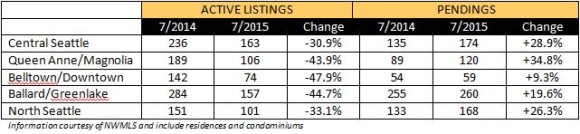
Inventory and Pendings
Below we compare the number of active listings (supply) and pendings (demand) for several of the key Seattle neighborhoods including Central Seattle, Queen Anne and Magnolia, Belltown and Downtown, Ballard and Greenlake, and North Seattle. Our table includes single family residences as well as condos comparing July 2014 and 2015.
All five of my listings are currently pending and were snapped up quick!
- Ravenna Area Residential Listed at $800,000 – pended in 7 days
- View Ridge Area Residential Listed at $550,000 – pended in 26 days
- University District Area Residential Listed at $525,000 – pended in 9 days
- Ravenna Area Residential Listed at $439,950 – pended in 19 days
- Townhome in Shoreline Listed at $375,000 – pended in 7 days
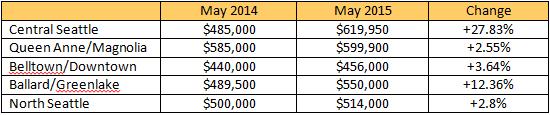
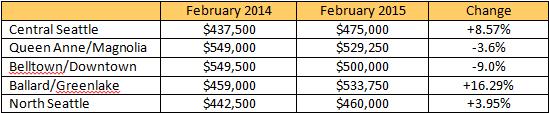
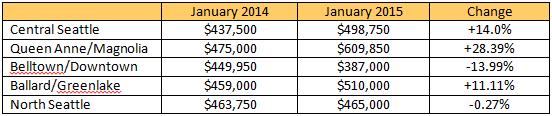
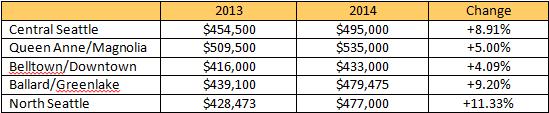
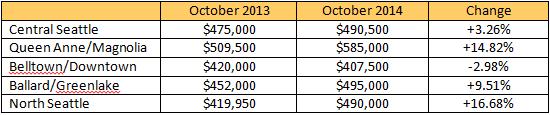
Median Sales Prices
The median sales price for Seattle for residential and condos decreased very slightly last month to $506,050 from the previous high of $507,500 the month before. However, year over year, the median sales price is up 11.7% since last July when it was $453,150. I expect median sales prices to continue to increase through the rest of 2015 until we can satiate demand either through more homes on the market or a decrease in buyers (which could be imminent if interest rates rise).

There is still time to sell if you want to take advantage of these market conditions. Things may start to change if the Federal Reserve increases interest rates in September (which, according to sources such as the Wall Street Journal, is likely to occur soon). Even if you are looking for an assessment of how your asset has appreciated, or may appreciate in the coming years, please contact me – your Seattle Home Guy – at sold@windermere.com or give me a call at (206) 226-5300.