Boy, could we have had a more amazing summer? Maybe mother nature was trying to make up to us Pacific Northwesterners for the devastating end to the Superbowl. I am excited for the fall and I am excited to see our Hawks play some ball again. Go Hawks!
This has also been quite the summer for Seattle real estate. Our market seems to have naturally slowed down just a little over the last few weeks as we cram in last vacations before the kids start school. Stock market volatility has also caused some to pause, but the fact is Seattle is a great place to invest in and some blips on the DJI aren’t going to change that. Through August, our inventory is still very low in Seattle (we haven’t had even 1,000 properties on the market for any month this whole year) and our pending numbers are high.
But let’s take a closer look at what the end of summer real estate market is like in Seattle and some key neighborhoods:
Inventory and Pendings
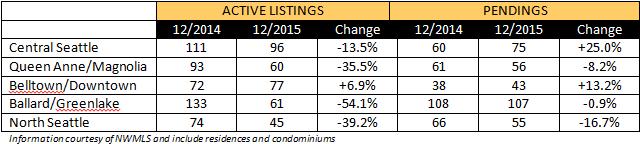
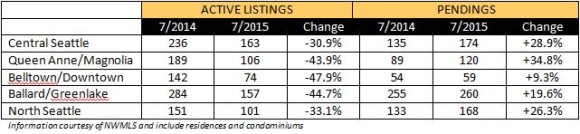
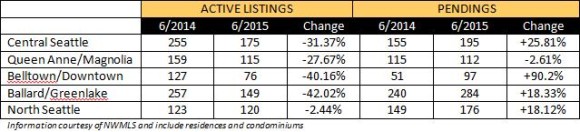
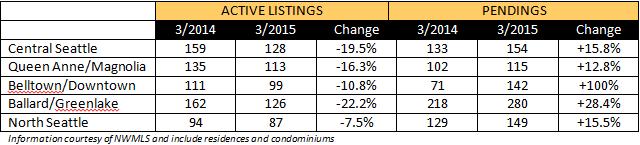
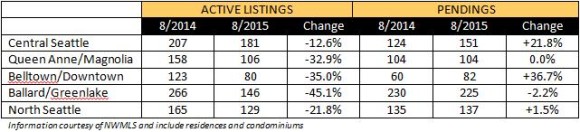
Below we compare the number of active listings (supply) and pendings (demand) for several of the key Seattle neighborhoods including Central Seattle, Queen Anne and Magnolia, Belltown and Downtown, Ballard and Greenlake, and North Seattle. Our table includes single family residences as well as condos comparing July 2014 and 2015.
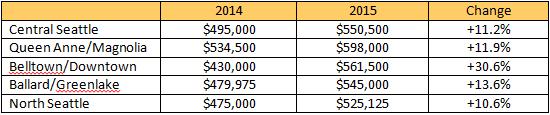
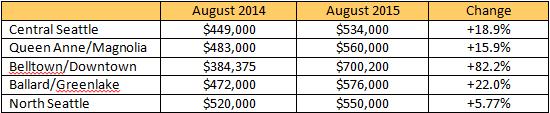
Median Sales Prices
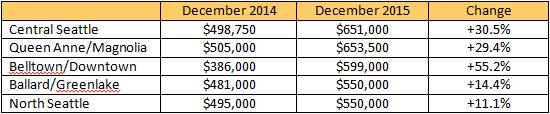
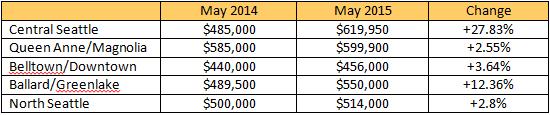
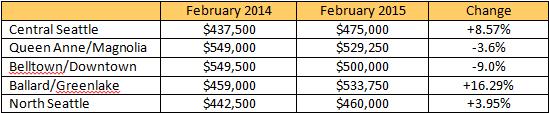
Median sales prices for Seattle residential and condos was up sharply in August, rising to a new all-time high of $537,800. This was 5.97% higher than the previous high of $507,500 set in June. Looking at year over year, August of 2014’s sales price median was $417,500, so we are looking at a 21.56% year-over-year increase.
Looking at the individual neighborhoods, Wow! Check out Belltown/Downtown. That is a significant increase which requires some explanation. In August of 2015 there were 137 sold homes and condos in the area ranging in price from $199,500 to $2,579,610. 27 of these were over $1,000,000. The former median price was $384,375, but there were only 5 of the 137 that sold were under that former median price. Compare that to last year when there were only 42 sales, the lowest was at $169,000 and the highest was $1,800,000 (with only five over $1,000,000). This makes a big difference. Does this mean prices have truly gone up over 80% in one year or is the product on the market different? The product on the market is different, there are more people buying condos as the price for homes is on the rise, so those two factors together is what I see happening in that particular neighborhood.
As I type this, there is massive speculation regarding whether or not the Federal Reserve will raise interest rates at their meeting on September 17th. If they do, this could change the real estate landscape a bit, but as I said before, Seattle will continue to be a great place to invest. Please contact me – your Seattle Home Guy – at sold@windermere.com or give me a call at (206) 226-5300 to discuss what this market means for you.