Inventory of Seattle of homes for sale is still at a ten year low for October at 1,018 homes and condos available for sale. The ten year average up to 2014 is 2,879 homes which puts us 64.6% below that average. Our pending listings were at 985 for October, which is above our 802 average (22.8% above average).
Let’s see what happened in the October Seattle real estate market in key neighborhoods:
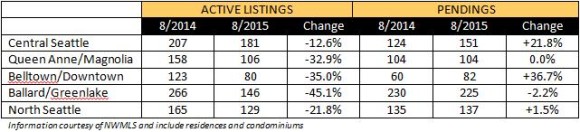
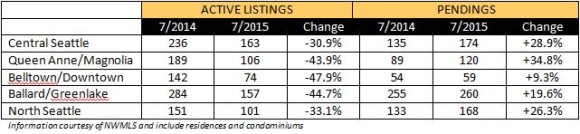
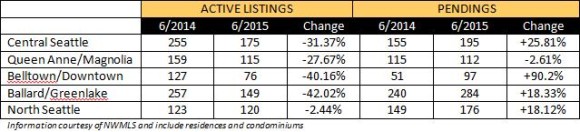
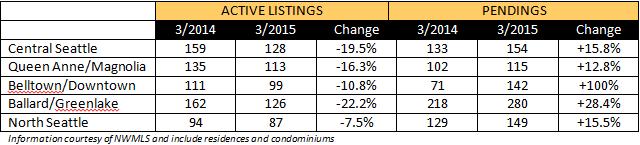
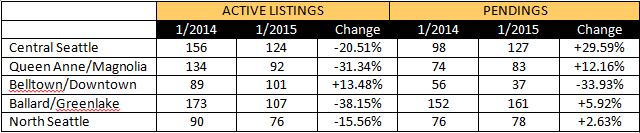
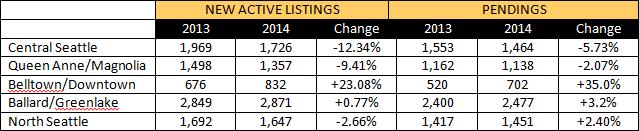
Inventory and Pendings
Below we compare the number of active listings (supply) and pendings (demand) for several of the key Seattle neighborhoods including Central Seattle, Queen Anne and Magnolia, Belltown and Downtown, Ballard and Greenlake, and North Seattle. Our table includes single family residences as well as condos comparing September 2014 and 2015.

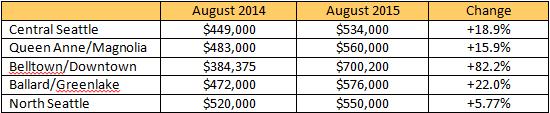
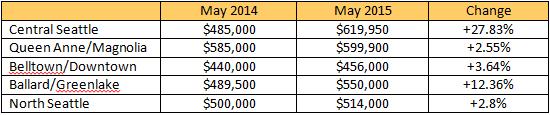
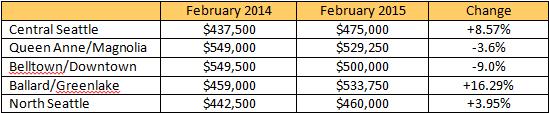
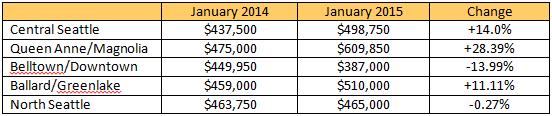
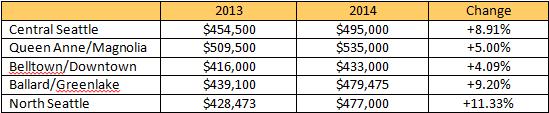
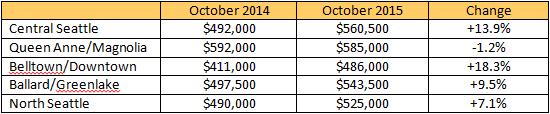
Median Sales Prices
Seattle residential and condo median home prices continued to see median sales price increase of 8.9% over last October to a price of $485,000.
The average days on market for sold residential and condos in October was 18 days. This includes properties up to $5,750,000 (the highest price sale in October). This is one day less than September’s sales. Last October, the average days on market in Seattle was 32, so we have had a 43.8% decline in days on market over the last year. That is remarkable!
While the Seattle real estate market appears to be undefeated, I wish I could say the same for the Seahawks. However, like the real estate market, I expect great things in the coming weeks! We are only half way through the season and eight games to go and you can bet I show up in my team blue each Friday and I hope you do too. Go Hawks!
Please contact me – your Seattle Home Guy – at sold@windermere.com or give me a call: (206) 226-5300 to discuss what this market means for you.