In the city of Seattle there are only 415 ACTIVE RESIDENTIAL listings on January 30th 2017.
The Seattle region has the 2nd lowest percentage of homes for sale of any metro area in the country with only 1 out of every 263 homes for sale!!!


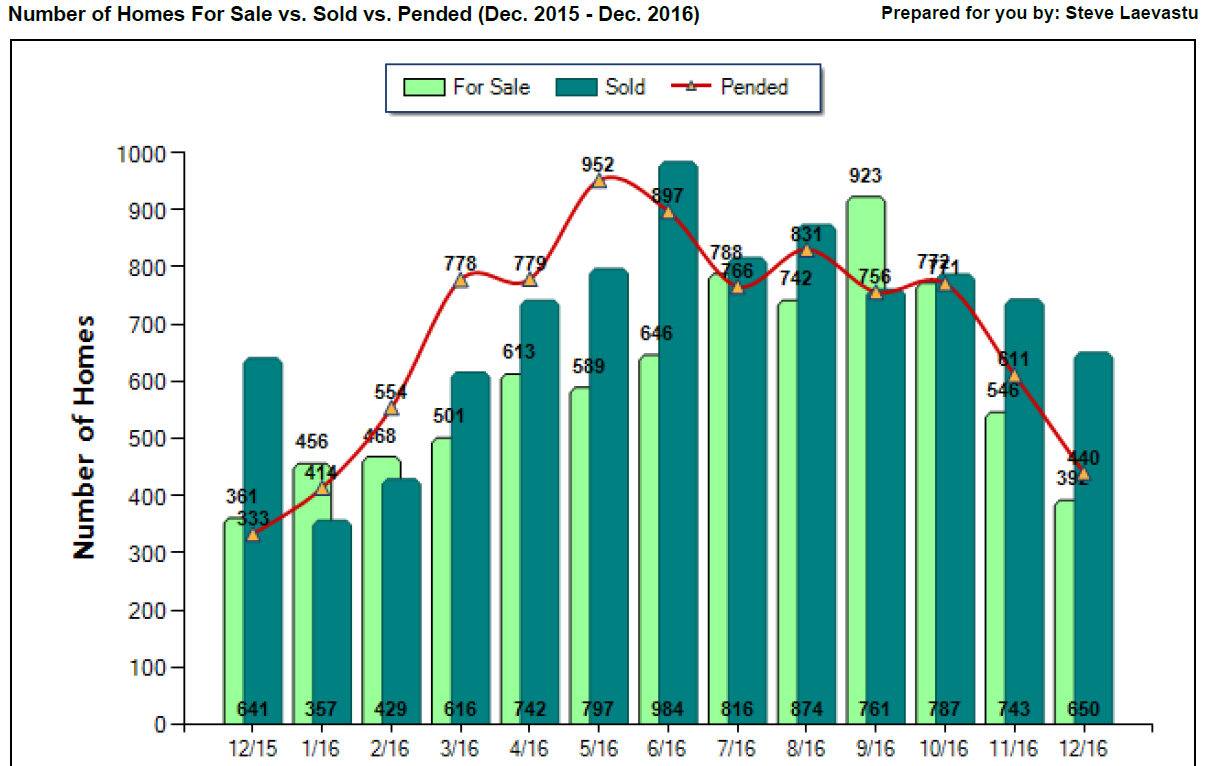
December was another great month for SELLERS in Seattle.
The median price of a Seattle home is now $625,000.
The median price of a Seattle home is up 9% vs December of 2015 when the median price was $575,000.
Please also note that the median sales price for Seattle hit a record of $650,000 in June of 2016. Therefore, the median sales price has come down 4% since the peak in September.
There were 440 pending sales in December which is up 32% from twelve months ago when 333 pending sales were reported.
SO WHAT HAPPENED TO SEATTLE REAL ESTATE IN DECEMBER?
In December there were 392 ACTIVE listings in the Seattle real estate market.
In December 440 homes went PENDING.
Which means that 1 out of every 0.89 homes on the market went pending in December.
This 0.89 ratio implies a 0.89 month’s supply of inventory.
The 0.89 ratio is a strong SELLER’S MARKET INDICATOR.
THE PAST 23 MONTHS HAVE SEEN THE BEST SELLER RATIOS EVER FOR SEATTLE ABSORPTON RATE.
Any ratio under 3.0 is a seller’s market indicator.
Any ratio between 3.0 and 6.0 is a neutral market indicator.
Any ratio over 6.0 is a buyer’s market indicator.
The story remains LACK OF INVENTORY.
In December there were 392 ACTIVE listings in Seattle.
The record low was set 12 months ago (December 2015) with 361 ACTIVE listings.
The 392 ACTIVE listings is 67% under our 10 year average for December inventory.
Another way of looking at it is that we are only at 33% of our average inventory for this time of year.
The December ten year moving average for inventory is 1,172 ACTIVE listings.
Interestingly, if we compare December 2016 to December 2015 we will note that in December 2015 there were 361 ACTIVE listings. In December 2016 there are 392 ACTIVE listings. Therefore inventory is up 9% vs one year ago!!
In the month of December the AVERAGE list price vs sales price for Seattle was 101%.
So the average home sold for 1% over the asking price in December!!!
This is the 23rd month in a row that the AVERAGE list price vs AVERAGE sales price has been at or over 100%
The AVERAGE days on market for a Seattle home in the month of December was 24 days before they accepted an offer. The record is 14 days which was set in May 2016.
And real estate is always LOCALIZED. What I mean is that CERTAIN areas are moving better than other areas. Let’s take a look at list price vs sales prices for some different neighborhoods in Seattle for the month of December.
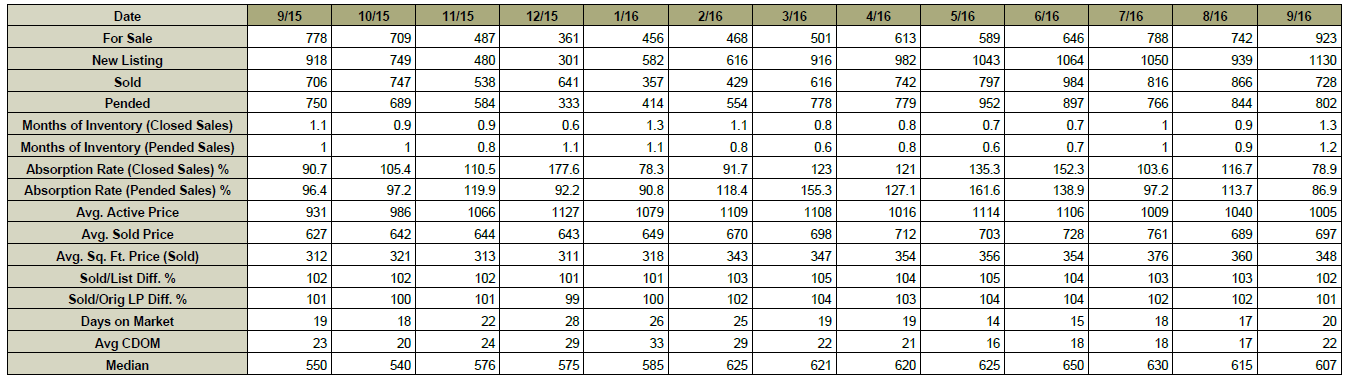
THE CHART AND GRAPH BELOW ARE REAL ESTATE STATISTICS FOR THE CITY OF SEATTLE.

If you have any questions or if I can be of any assistance please contact me.
Thank you,
Steve Laevastu
cell 206-226-5300
sold@windermere.com
SEATTLE HOUSING MARKET UPDATE
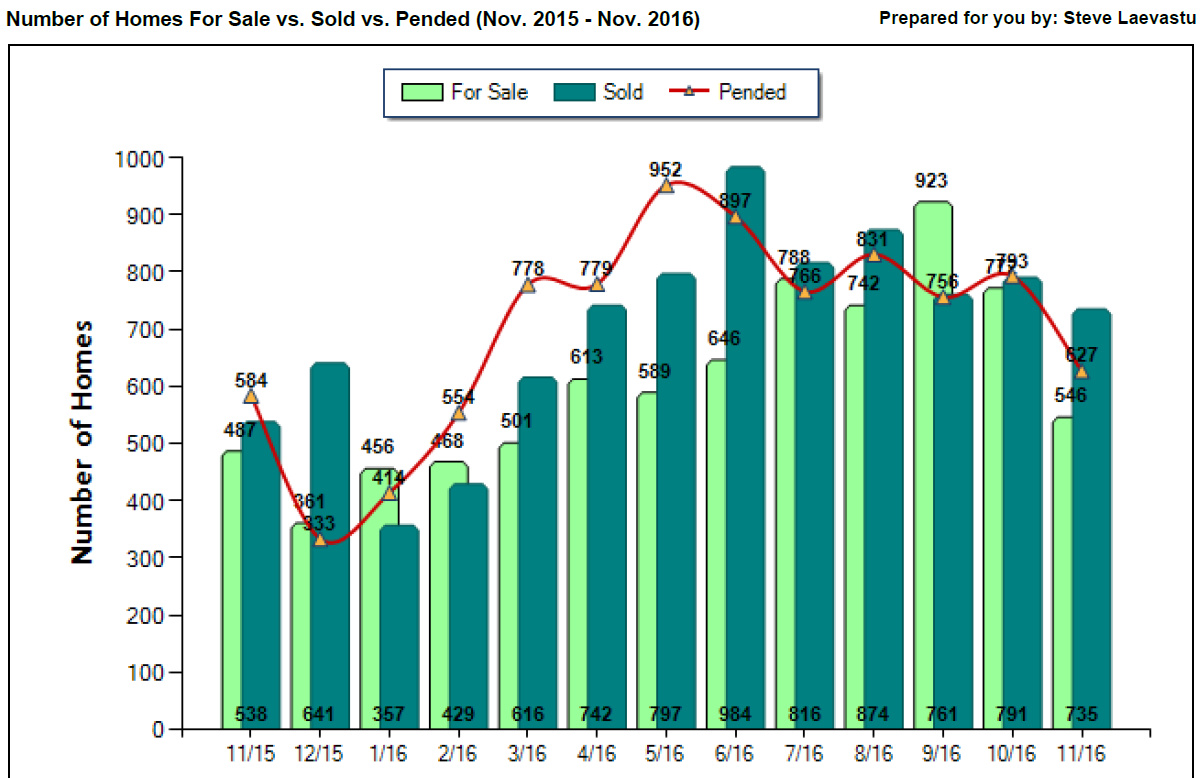
November was another great month for SELLERS in Seattle.
The median price of a Seattle home is now $600,000.
The median price of a Seattle home is up 4% vs November of 2015 when the median price was $576,000.
Please also note that the median sales price for Seattle hit a record of $650,000 in June of 2016. Therefore, the median sales price has come down 8% since the peak in September.
There were 627 pending sales in November which is up 7% from twelve months ago when 584 pending sales were reported.
SO WHAT HAPPENED TO SEATTLE REAL ESTATE IN NOVEMBER?
In November there were 546 ACTIVE listings in the Seattle real estate market.
In November 627 homes went PENDING.
Which means that 1 out of every 0.87 homes on the market went pending in November.
This 0.87 ratio implies a 0.87 month’s supply of inventory.
The 0.87 ratio is a strong SELLER’S MARKET INDICATOR.
THE PAST 23 MONTHS HAVE SEEN THE BEST SELLER RATIOS EVER FOR SEATTLE ABSORPTON RATE.
Any ratio under 3.0 is a seller’s market indicator.
Any ratio between 3.0 and 6.0 is a neutral market indicator.
Any ratio over 6.0 is a buyer’s market indicator.
The story remains LACK OF INVENTORY.
In November there were 546 ACTIVE listings in Seattle.
The record low was set 11 months ago (December 2015) with 361 ACTIVE listings.
The 546 ACTIVE listings is 64% under our 10 year average for November inventory.
Another way of looking at it is that we are only at 36% of our average inventory for this time of year.
The November ten year moving average for inventory is 1,533 ACTIVE listings.
Interestingly, if we compare November 2016 to November 2015 we will note that in November 2015 there were 487 ACTIVE listings. In November 2016 there are 546 ACTIVE listings. Therefore inventory is up 12% vs one year ago!!
In the month of November the AVERAGE list price vs sales price for Seattle was 101%.
So the average home sold for 1% over the asking price in November!!!
This is the 22nd month in a row that the AVERAGE list price vs AVERAGE sales price has been at or over 100%
The AVERAGE days on market for a Seattle home in the month of November was 21 days before they accepted an offer. The record is 14 days which was set in May 2016.
And real estate is always LOCALIZED. What I mean is that CERTAIN areas are moving better than other areas. Let’s take a look at list price vs sales prices for some different neighborhoods in Seattle for the month of November.
· Bryant 108%
· Wedgwood 106%
· Green Lake 106%
· Wallingford 103%
· Maple Leaf 103%
· Capitol Hill 103%
· Ballard 103%
· Ravenna 102%
· Seward Park 102%
· West Seattle 101%
· View Ridge & Hawthorne Hills 100%
· Queen Anne 100%
· Montlake 100%
· Magnolia 100%
· Laurelhurst 99%
· Lake City 97%
THE CHART AND GRAPH BELOW ARE REAL ESTATE STATISTICS FOR THE CITY OF SEATTLE.

If you have any questions or if I can be of any assistance please contact me.
Thank you,
Steve Laevastu
cell 206-226-5300
sold@windermere.com
Statistically the Seattle real estate market is still in a STRONG SELLER’S MARKET.
However, in my opinion the frenzy pace is not like it was a few months ago.
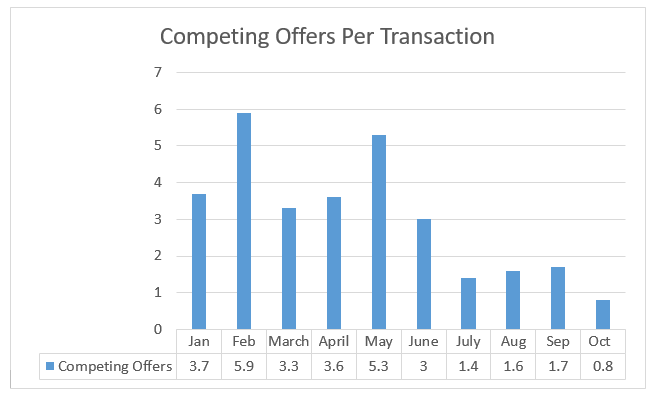
My Windermere office tracks sends out a questionnaire with every deal that is turned into my office. And one of the questions on the questionnaire is” how many offers were you competing against?”
Here is the data from my office
Office Stats- Competitive Offers per Transaction
Please note that 0.8 offers per transaction is a GREAT NUMBER!!! However, it is down substantially from the January through June pace. And it is the lowest/slowest number in 2016.
Thank you,
Steve Laevastu
Cell 206-226-5300
October was another great month for SELLERS in Seattle.
The median price of a Seattle home is now $612,000.
The median price of a Seattle home is up 13% vs October of 2015 when the median price was $540,000. Please also note, that the median price had dropped THREE MONTHS IN A ROW prior to October. Also note that the median sales price for the last 3 months in a row is the lowest median sales price since January 2016 when the median sales price was $585,000.
There were 816 pending sales in October, which is up 18% from twelve months ago when 689 pending sales were reported.
SO WHAT HPPENED TO SEATTLE REAL ESTATE IN OCTOBER?
In October there were 772 ACTIVE listings in the Seattle real estate market.
In October 816 homes went PENDING.
Which means that 1 out of every 0.946 homes on the market went pending in October.
This 0.946 ratio implies a 0.946 month’s supply of inventory.
The 0.946 ratio is a strong SELLER’S MARKET INDICATOR.
THE PAST 22 MONTHS HAVE SEEN THE BEST SELLER RATIOS EVER FOR SEATTLE ABSORPTON RATE.
Any ratio under 3.0 is a seller’s market indicator.
Any ratio between 3.0 and 6.0 is a neutral market indicator.
Any ratio over 6.0 is a buyer’s market indicator.
The story remains LACK OF INVENTORY.
In October there were 772 ACTIVE listings in Seattle.
The record low was set 10 months ago (December 2015) with 361 ACTIVE listings.
The 772 ACTIVE listings is 57% under our 10 year average for October inventory.
Another way of looking at it is that we are only at 43% of our average inventory for this time of year.
The October ten year moving average for inventory is 1,782 ACTIVE listings.
Interestingly, if we compare October 2016 to October2015 we will note that in October 2015 there were 709 ACTIVE listings. In October 2016 there are 772 ACTIVE listings. Therefore inventory is up 10% vs one year ago!!
In the month of October the AVERAGE list price vs sales price for Seattle was 102%.
So the average home sold for 2% over the asking price in October!!!
This is the 21st month in a row that the AVERAGE list price vs AVERAGE sales price has been at or over 100%
The AVERAGE days on market for a Seattle home in the month of October was 17 days before they accepted an offer. The record is 14 days which was set in May 2016.
And real estate is always LOCALIZED. What I mean is that CERTAIN areas are moving better than other areas. Let’s take a look at list price vs sales prices for some different neighborhoods in Seattle for the month of Ocotber.
THE CHART AND GRAPH BELOW ARE REAL ESTATE STATISTICS FOR THE CITY OF SEATTLE.


If you have any questions or if I can be of any assistance please contact me.
Thank you,
Steve Laevastu
cell 206-226-5300
sold@windermere.com
I saw this trailer in the Bryant neighborhood.
Coolest trailer I have ever seen!
Go Hawks! Go Dawgs!

There is currently a court case in Pierce County where the attorney general’s office believes it is discriminatory for a landlord to screen tenants based upon criminal history!!! Are felons and sex offenders now a protected class? Or does screening tenants based upon criminal records violate the Fair Housing Act?
The case involves a property manager in Tacoma who screened the tenant based upon criminal history.
The lawsuit has yet to be decided.
I recommend seeking the advice of legal counsel to ensure that you have sufficient protocols to avoid legal prosecution against discrimination or violating the Fair Housing Act.
September was another great month for SELLERS in Seattle, HOWEVER, inventory picked up and the frenzy pace slowed down!!
The median price of a Seattle home is now $607,000.
The median price of a Seattle home is up 10% vs September of 2015 when the median price was $550,000. Please also note, that the median price has dropped THREE MONTHS IN A ROW. Also note that the median sales price of $607,000 is the lowest median sales price since January 2016 when the median sales price was $585,000.
There were 802 pending sales in September, which is up 8% from twelve months ago when 750 pending sales were reported.
In September there were 923 ACTIVE listings in the Seattle real estate market.
In September 802 homes went PENDING.
Which means that 1 out of every 1.2 homes on the market went pending in September.
This 1.2 ratio implies a 1.2 month’s supply of inventory.
The 1.2 ratio is a strong SELLER’S MARKET INDICATOR.
THE PAST 21 MONTHS HAVE SEEN THE BEST SELLER RATIOS EVER FOR SEATTLE ABSORPTON RATE.
Any ratio under 3.0 is a seller’s market indicator.
Any ratio between 3.0 and 6.0 is a neutral market indicator.
Any ratio over 6.0 is a buyer’s market indicator.
The story remains LACK OF INVENTORY.
EPIC RECORD SETTING LOW INVENTORY!!!
HOWEVER, THERE ARE SIGNS THAT INVENTORY IS STARTING TO CREEP UP!!
In September there were 923 ACTIVE listings in Seattle.
The record low was set 8 months ago (December 2015) with 361 ACTIVE listings.
The 923 ACTIVE listings is 52% under our 10 year average for September inventory.
Another way of looking at it is that we are only at 48% of our average inventory for this time of year.
The September ten year moving average for inventory is 1,938 ACTIVE listings.
Interestingly, if we compare September 2016 to September 2015 we will note that in September 2015 there were 778 ACTIVE listings. In September 2016 there are 923 ACTIVE listings. Therefore inventory is up 19% vs one year ago!!
In the month of September the AVERAGE list price vs sales price for Seattle was 102%.
So the average home sold for 2% over the asking price in September!!!
This is the 20th month in a row that the AVERAGE list price vs AVERAGE sales price has been at or over 100%
The AVERAGE days on market for a Seattle home in the month of September was 20 days before they accepted an offer. The record is 14 days which was set in May 2016.
And real estate is always LOCALIZED. What I mean is that CERTAIN areas are moving better than other areas. Let’s take a look at list price vs sales prices for some different neighborhoods in Seattle for the month of August.
THE CHART AND GRAPH BELOW ARE REAL ESTATE STATISTICS FOR THE CITY OF SEATTLE.

If you have any questions or if I can be of any assistance please contact me.
Thank you,
Steve Laevastu
cell 206-226-5300
sold@windermere.com
I thought I would devote this blog to some of my most frequently asked questions.
“Steve, we are ready to move, but we never got around to updating the powder room downstairs. It has pink fixtures and pink floral wallpaper, circa 1982. Do you think I need to update the bathroom before I put the home on the market?”
Although this ultimately depends on the buyer, anything that shrinks the buyer pool ultimately can lessen demand for your home. A buyer might walk into that bathroom and say, “Whoa. That is too much work. I am out!” If enough buyers decide it is too much to take on, then you may not get an offer for your property OR an offer may be less than you expect. Or, you may just happen to get the right buyer to come along who is up to the task! As far as powder room updates go, removing wallpaper, replacing a sink, toilet, mirror, lighting, and a little storage shouldn’t cost too much and it is probably worth doing. But let’s talk about it! Continue reading