


SEATTLE HOUSING MARKET UPDATE
The January real estate market continued to remain extremely hot for sellers!!
The new report summarizing January activity shows year-over-year gains in pending sales, and prices.
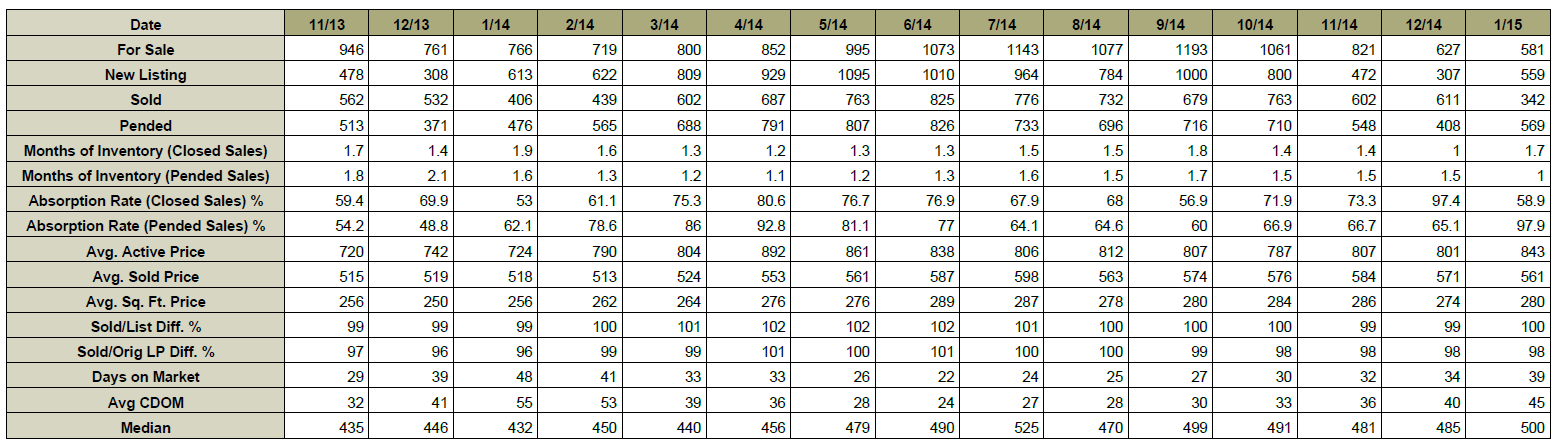
The median price of a Seattle home is now $500,000 which is up 16% from one year ago when the median price of a Seattle home was $432,000. HOWEVER, THE 16% JUMP IN PRICE MIGHT BE AN ANOMALY DUE TO ONLY 342 CLOSINGS IN JANUARY.
Because if we look at the data differently and compare the Seattle median sales price in 2014 of $478,000 to the Seattle median sales price so far in 2015 of $499,496 therefore I think the 16% jump is an anomaly.
MEDIAN SEATTLE JANUARY HOME PRICE PAST 10 YEARS
2005 = $390,000
2006 = $439,500
2007 = $459,950
2008 = $430,000
2009 = $391,000
2010 = $399,000
2011 = $365,000
2012 = $399,500
2013 = $444,599
2014 = $478,000
2015 = $499,496
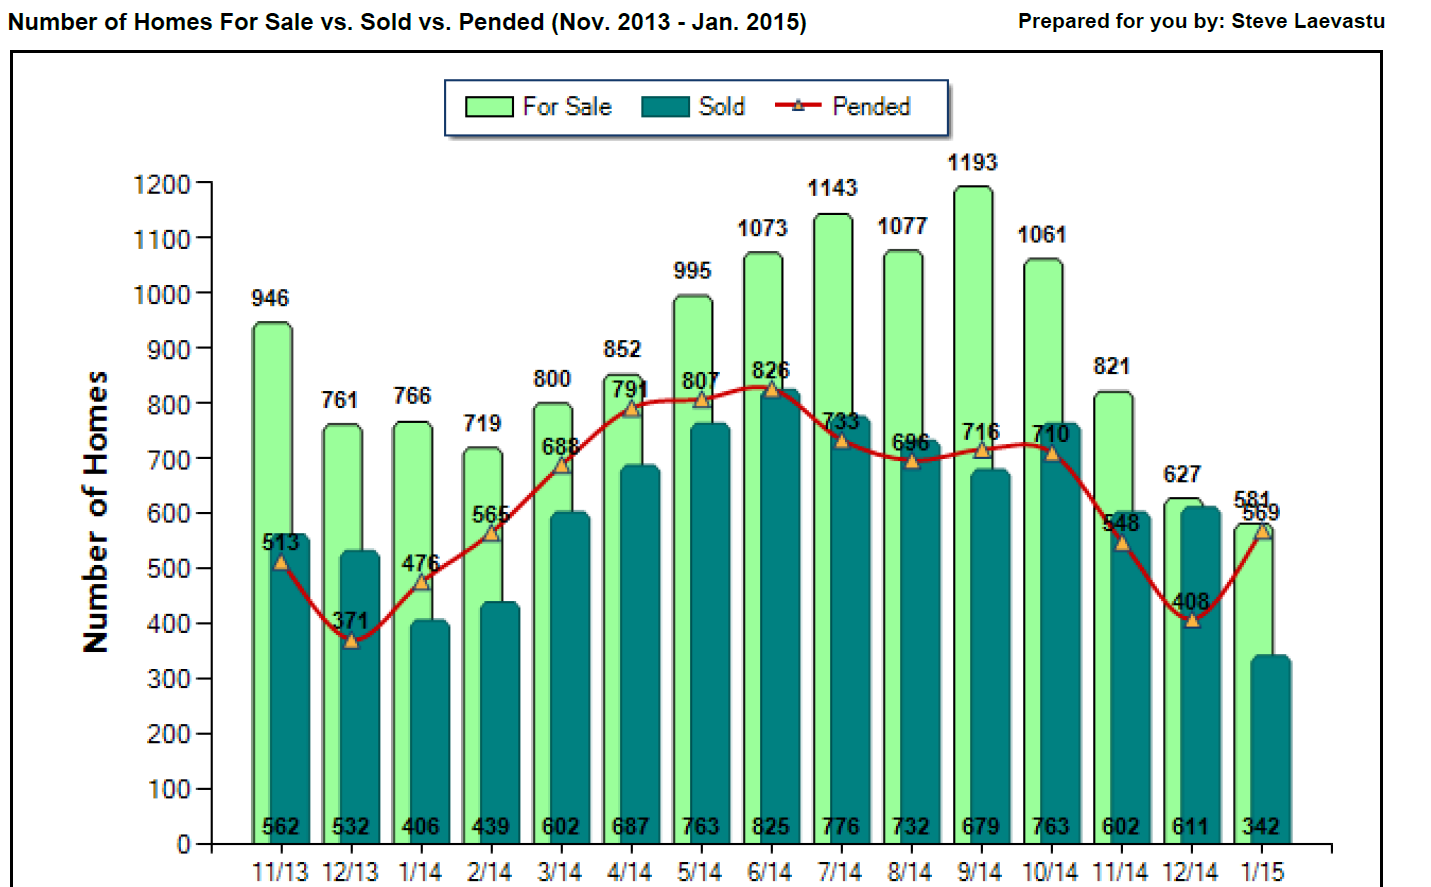
There were 569 pending sales in January, which is up 17% from twelve months ago when 476 pending sales were reported.
SO WHAT HAPPENED TO SEATTLE REAL ESTATE IN JANUARY?
In January there were 581 ACTIVE listings in the Seattle real estate market.
THIS IS THE LOWEST NUMBER OF ACTIVE LISTINGS THAT I HAVE EVER SEEN IN SEATTLE REAL ESTATE IN MY 28 YEARS IN THE BUSINESS!!!
In January 569 homes went PENDING.
Which means that 1 out of every 1.02 homes on the market went pending in January.
This 1.02 ratio implies a 1.02 month supply of inventory.
The 1.02 ratio is a strong SELLER’S MARKET INDICATOR.
The 1.02 ratio for Seattle is the BEST RATIO I HAVE EVER SEEN IN MY 28 YEARS AS A REALTOR.
Any ratio under 3.0 is a seller’s market indicator.
Any ratio between 3.0 and 6.0 is a neutral market indicator.
Any ratio over 6.0 is a buyer’s market indicator.
The story remains LACK OF INVENTORY.
HISTORIC ALL TIME RECORD LOW INVENTORY FOR SEATTLE!!
The 581 ACTIVE listings is 61% under our 10 year average for January inventory.
The January ten year moving average for inventory is 1,465 ACTIVE listings.
Also if we compare January 2015 to January 2014 we will note that even though inventory was low in January 2014 (719) it was even lower in January 2015 (581). Inventory is down 24% vs 2015.
In the month of January the list price vs sales price was 100%.
WHAT TO EXPECT IN FEBRUARY?
Inventory always bottoms out in Seattle on December 31st. And new inventory starts to hit the market on January 1st. HOWEVER, THE FIRST 5 WEEKS OF 2015 VERY LITTLE NEW INVENTORY HAS BEEN HITTING THE MARKET. I expect February inventory to increase slightly from the RECORD LOW INVENTORY OF 581 ACTIVE LISTINGS.
And because buyers still have very little to choose from I expect the pending units for January to come in around 550.
The past 6 months have had INVENTORY/PENDING ratios of 1.0 to 1.7 (a strong seller’s market) therefore I expect February to be the same since no leading indicator/parameter has really changed much over the past few months.
- Inventory remains historically low
- The Seattle economy is very strong with unemployment of approximately 4%
- Interest rates remain outstanding with fixed 30 year mortgages hovering slightly below 4%
So expect February to be another great month for sellers with an inventory/pendings ratio of 1.0 to 1.7
And with the market being so out of equilibrium I expect the AVERAGE SALES PRICE TO LIST PRICE RATIO TO BE OVER 100%. I think it will come in at 101%
If you have any questions or concerns please feel free to contact Steve Laevastu 206-226-5300 sold@windermere.com
Please see the graphs and charts below
If you have any questions or if I can be of any assistance please contact me.
Thank you,
Steve Laevastu
cell 206-226-5300
sold@windermere.com
www.SeattleHomeGuy.com