


We have had a slight increase in inventory in many neighborhoods which is much-needed. Let’s take a look at what happened in Seattle’s July real estate market in key neighborhoods.
Inventory and Pendings
Below we compare the number of active listings (supply) and pendings (demand) for several of the key Seattle neighborhoods including Central Seattle, Queen Anne and Magnolia, Belltown and Downtown, Ballard and Greenlake, and North Seattle. Our table includes single family residences as well as condos comparing July 2015 and 2016.

Overall, Seattle’s inventory of active listings increased 916 in June to 1,081 last month. Pendings were down slightly (from 1,237 in June to 1,107 last month).
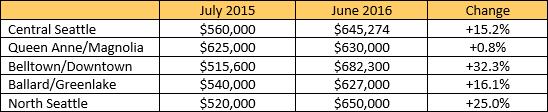
Median Sales Prices
Seattle’s median sales price for both residential and condos grew from $506,000 last July to $583,250 last month (represents a 15.3% gain). Looking at residential and condos separately, residential prices are up 14.0% ($560,000 to $638,585) and condo prices are up 12.1% ($410,000 to $459,475).
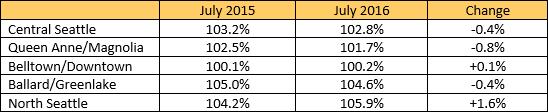
List Price to Sales Price
When the list price to sales price is over 100%, this is usually an indicator of multiple offers. For all of Seattle, last July’s list price to sales price ratio was 103.4% as opposed to 104.4% this last month.
I can’t believe we are only a few weeks away from the Seahawks pre-season! I am very excited! If you would like additional information on our market, please contact me – your Seattle Home Guy – at sold@windermere.com or give me a call: (206) 226-5300.