I am still in awe of that amazing Seahawks win on Sunday. Let’s keep it up! Go Hawks!
Let’s take a look at what happened in Seattle’s August real estate market in key neighborhoods: Continue reading


I am still in awe of that amazing Seahawks win on Sunday. Let’s keep it up! Go Hawks!
Let’s take a look at what happened in Seattle’s August real estate market in key neighborhoods: Continue reading
We have had a slight increase in inventory in many neighborhoods which is much-needed. Let’s take a look at what happened in Seattle’s July real estate market in key neighborhoods.
Inventory and Pendings
Below we compare the number of active listings (supply) and pendings (demand) for several of the key Seattle neighborhoods including Central Seattle, Queen Anne and Magnolia, Belltown and Downtown, Ballard and Greenlake, and North Seattle. Our table includes single family residences as well as condos comparing July 2015 and 2016.

Overall, Seattle’s inventory of active listings increased 916 in June to 1,081 last month. Pendings were down slightly (from 1,237 in June to 1,107 last month).
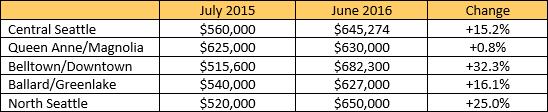
Median Sales Prices
Seattle’s median sales price for both residential and condos grew from $506,000 last July to $583,250 last month (represents a 15.3% gain). Looking at residential and condos separately, residential prices are up 14.0% ($560,000 to $638,585) and condo prices are up 12.1% ($410,000 to $459,475).
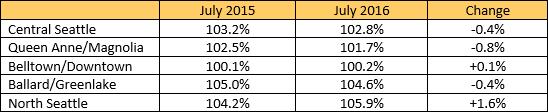
List Price to Sales Price
When the list price to sales price is over 100%, this is usually an indicator of multiple offers. For all of Seattle, last July’s list price to sales price ratio was 103.4% as opposed to 104.4% this last month.
I can’t believe we are only a few weeks away from the Seahawks pre-season! I am very excited! If you would like additional information on our market, please contact me – your Seattle Home Guy – at sold@windermere.com or give me a call: (206) 226-5300.
Let’s see what happened in Seattle’s real estate market in key neighborhoods this April!
Inventory and Pendings
Below we compare the number of active listings (supply) and pendings (demand) for several of the key Seattle neighborhoods including Central Seattle, Queen Anne and Magnolia, Belltown and Downtown, Ballard and Greenlake, and North Seattle. Our table includes single family residences as well as condos comparing April 2015 and 2016.
I am glad to see the number of homes on the market picking up as there are a lot of buyers out there who need to buy homes! I have ten listings and six of them pended in about seven days. The others haven’t been on the market yet a week but I expect them to go fast.
Let’s see what happened in Seattle’s March real estate market in key neighborhoods: Continue reading
Mariners baseball is starting in just a few weeks, the tulips are up, and all my listings are pending! Let’s see what happened in Seattle’s February real estate market in key neighborhoods:
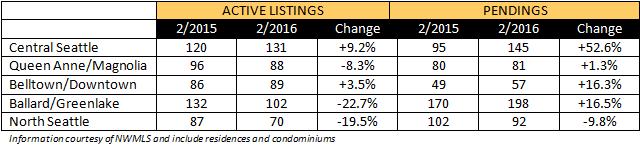
Inventory and Pendings
Below we compare the number of active listings (supply) and pendings (demand) for several of the key Seattle neighborhoods including Central Seattle, Queen Anne and Magnolia, Belltown and Downtown, Ballard and Greenlake, and North Seattle. Our table includes single family residences as well as condos comparing February 2015 and 2016.
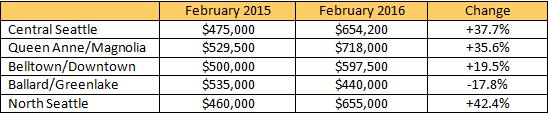
Median Sales Prices
Median sales prices are up quite dramatically in some areas comparing February 2015 versus February 2016 numbers. See the tables below!
With the number of sales dropping in some areas due to lack of inventory, median sales price adjustments may get more pronounced. For example, in North Seattle, the number of sales dropped from 81 last February to 65 this February. However, in Ballard/Greenlake, the sales went from 119 last year to 189. Belltown went from 23 last year to 40 this year. Queen Anne/Magnolia was about at par with 69 sales last year and 71 this year. Central Seattle went from 105 to 83.
In Ballard/Greenlake, there were several lower-priced properties that sold that might be skewing the median a bit. The Cove at Verdian counted for 8 of the 189 sales, all under $239,000. In addition the Vik condo project accounted for 64 sales, ranging from to $261,900 to $755,900.
Just like in Belltown last summer with the Ensignia project, as inventory is low and a buildings-worth of new product comes on the market, I expect median home prices to skew based on the pricing in the development.
The median home price for February in all of Seattle for both residential and condos was $511,000, which is 16.1% above last February’s $440,000. February had 695 listings available on the market and as of this writing, there are 747 active listings, which is good for our market.
If you would like to learn more about what is happening in your neighborhood, let’s talk! Please contact me – your Seattle Home Guy – at sold@windermere.com or give me a call: (206) 226-5300.
It already feels a little spring-like in Seattle. Trees are beginning to bloom, the days are getting longer, and the real estate market never even took a breath in the winter. Let’s see what happened in Seattle’s January real estate market in key neighborhoods:
Inventory and Pendings
Below we compare the number of active listings (supply) and pendings (demand) for several of the key Seattle neighborhoods including Central Seattle, Queen Anne and Magnolia, Belltown and Downtown, Ballard and Greenlake, and North Seattle. Our table includes single family residences as well as condos comparing January 2015 and 2016.

Median Sales Prices
Prices are mostly up looking at January 2015 versus January 2016 numbers. See the tables below!
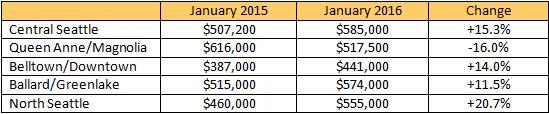
The median home price for January in all of Seattle for both residential and condos was $520,000, which is 15.0% above last January’s $452,000. I was glad to see the amount of available inventory go up in January, from 548 in December to 659 this month. Last January actually had fewer listings than December, so it was good to see this shift as buyers are out in droves.
If you are thinking of a move this year, let’s talk! Please contact me – your Seattle Home Guy – at sold@windermere.com or give me a call: (206) 226-5300.
This 2016 is starting with the lowest number of homes for sale in Seattle in years! In December there were only 359 homes and condos for sale in all of Seattle. Let’s see what happened in Seattle’s November real estate market in key neighborhoods:
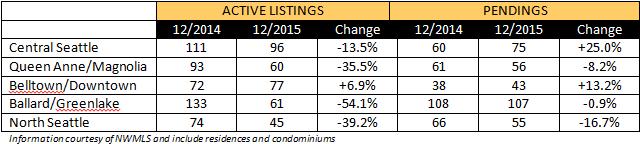
Inventory and Pendings
Below we compare the number of active listings (supply) and pendings (demand) for several of the key Seattle neighborhoods including Central Seattle, Queen Anne and Magnolia, Belltown and Downtown, Ballard and Greenlake, and North Seattle. Our table includes single family residences as well as condos comparing December 2014 and 2015.
Median Sales Prices
Prices are up both year over year and month over month. See the tables below!
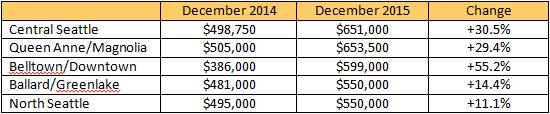
I predict that 2016 will be another banner year in Seattle real estate, and I am hopeful that when interest rates start to go up our market will even back out in terms of supply and demand. Have a question about what to do about what to do with your real estate this year? Please contact me – your Seattle Home Guy – at sold@windermere.com or give me a call: (206) 226-5300.
Usually things quiet down a bit this time of year, especially between Thanksgiving and Christmas. Not so in 2015! Buyers who were frustrated this summer due to not winning with multiple offers are back, hoping to buy while there is a slight lull and before interest rates go up. However, we aren’t seeing the bump in available inventory this late fall. In fact, in November, we dropped to the lowest number of homes and condos available for sale in the last ten years at 740 units. The number of homes under contract for November was 821 which means that properties are still flying off the market very quickly and the demand cannot be satiated!
Let’s see what happened to Seattle’s real estate market in key neighborhoods this November:
Inventory and Pendings
Below we compare the number of active listings (supply) and pendings (demand) for several of the key Seattle neighborhoods including Central Seattle, Queen Anne and Magnolia, Belltown and Downtown, Ballard and Greenlake, and North Seattle. Our table includes single family residences as well as condos comparing September 2014 and 2015.

Median Sales Prices
Prices are still on the rise. November’s median home price for residential and condos was $513,600 – a 17% increase over last November. 17%! In fact, the only month ever with a higher median sold price was this last August at $536,000.

I do expect the Federal Reserve will be raising rates in December, and although that might give buyers some breathing room due to less competition, there is still a lot of pent up demand (and still-growing demand due to our local economy) to be satisfied before we can resume a more-normal market.
My predictions will be out soon for 2016 and if you would like to receive those by mail, please contact me – your Seattle Home Guy – at sold@windermere.com or give me a call: (206) 226-5300.
Inventory of Seattle of homes for sale is still at a ten year low for October at 1,018 homes and condos available for sale. The ten year average up to 2014 is 2,879 homes which puts us 64.6% below that average. Our pending listings were at 985 for October, which is above our 802 average (22.8% above average).
Let’s see what happened in the October Seattle real estate market in key neighborhoods:
Inventory and Pendings
Below we compare the number of active listings (supply) and pendings (demand) for several of the key Seattle neighborhoods including Central Seattle, Queen Anne and Magnolia, Belltown and Downtown, Ballard and Greenlake, and North Seattle. Our table includes single family residences as well as condos comparing September 2014 and 2015.

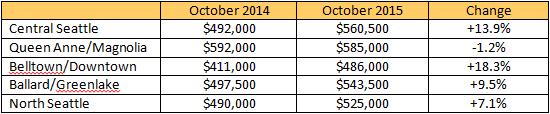
Median Sales Prices
Seattle residential and condo median home prices continued to see median sales price increase of 8.9% over last October to a price of $485,000.
The average days on market for sold residential and condos in October was 18 days. This includes properties up to $5,750,000 (the highest price sale in October). This is one day less than September’s sales. Last October, the average days on market in Seattle was 32, so we have had a 43.8% decline in days on market over the last year. That is remarkable!
While the Seattle real estate market appears to be undefeated, I wish I could say the same for the Seahawks. However, like the real estate market, I expect great things in the coming weeks! We are only half way through the season and eight games to go and you can bet I show up in my team blue each Friday and I hope you do too. Go Hawks!
Please contact me – your Seattle Home Guy – at sold@windermere.com or give me a call: (206) 226-5300 to discuss what this market means for you.
Boy, could we have had a more amazing summer? Maybe mother nature was trying to make up to us Pacific Northwesterners for the devastating end to the Superbowl. I am excited for the fall and I am excited to see our Hawks play some ball again. Go Hawks!
This has also been quite the summer for Seattle real estate. Our market seems to have naturally slowed down just a little over the last few weeks as we cram in last vacations before the kids start school. Stock market volatility has also caused some to pause, but the fact is Seattle is a great place to invest in and some blips on the DJI aren’t going to change that. Through August, our inventory is still very low in Seattle (we haven’t had even 1,000 properties on the market for any month this whole year) and our pending numbers are high.
But let’s take a closer look at what the end of summer real estate market is like in Seattle and some key neighborhoods:
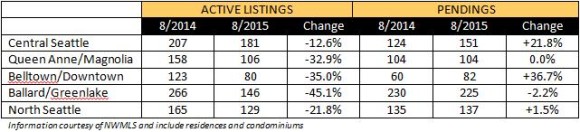
Inventory and Pendings
Below we compare the number of active listings (supply) and pendings (demand) for several of the key Seattle neighborhoods including Central Seattle, Queen Anne and Magnolia, Belltown and Downtown, Ballard and Greenlake, and North Seattle. Our table includes single family residences as well as condos comparing July 2014 and 2015.
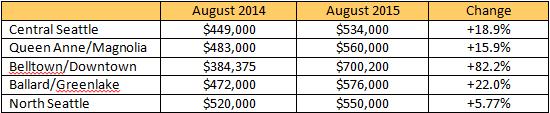
Median Sales Prices
Median sales prices for Seattle residential and condos was up sharply in August, rising to a new all-time high of $537,800. This was 5.97% higher than the previous high of $507,500 set in June. Looking at year over year, August of 2014’s sales price median was $417,500, so we are looking at a 21.56% year-over-year increase.
Looking at the individual neighborhoods, Wow! Check out Belltown/Downtown. That is a significant increase which requires some explanation. In August of 2015 there were 137 sold homes and condos in the area ranging in price from $199,500 to $2,579,610. 27 of these were over $1,000,000. The former median price was $384,375, but there were only 5 of the 137 that sold were under that former median price. Compare that to last year when there were only 42 sales, the lowest was at $169,000 and the highest was $1,800,000 (with only five over $1,000,000). This makes a big difference. Does this mean prices have truly gone up over 80% in one year or is the product on the market different? The product on the market is different, there are more people buying condos as the price for homes is on the rise, so those two factors together is what I see happening in that particular neighborhood.
As I type this, there is massive speculation regarding whether or not the Federal Reserve will raise interest rates at their meeting on September 17th. If they do, this could change the real estate landscape a bit, but as I said before, Seattle will continue to be a great place to invest. Please contact me – your Seattle Home Guy – at sold@windermere.com or give me a call at (206) 226-5300 to discuss what this market means for you.