SEATTLE HOUSING MARKET UPDATE
October 2015 was another GREAT MONTH FOR SELLERS IN SEATTLE!!
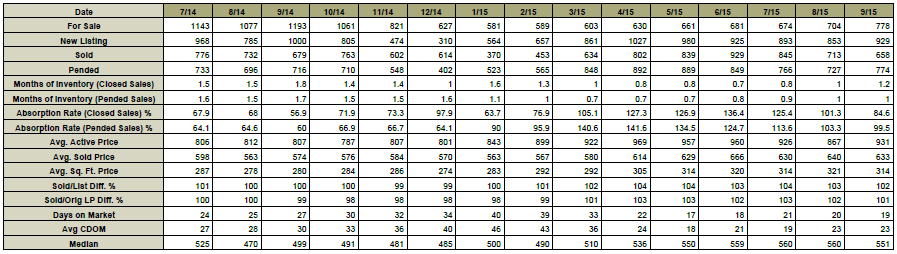
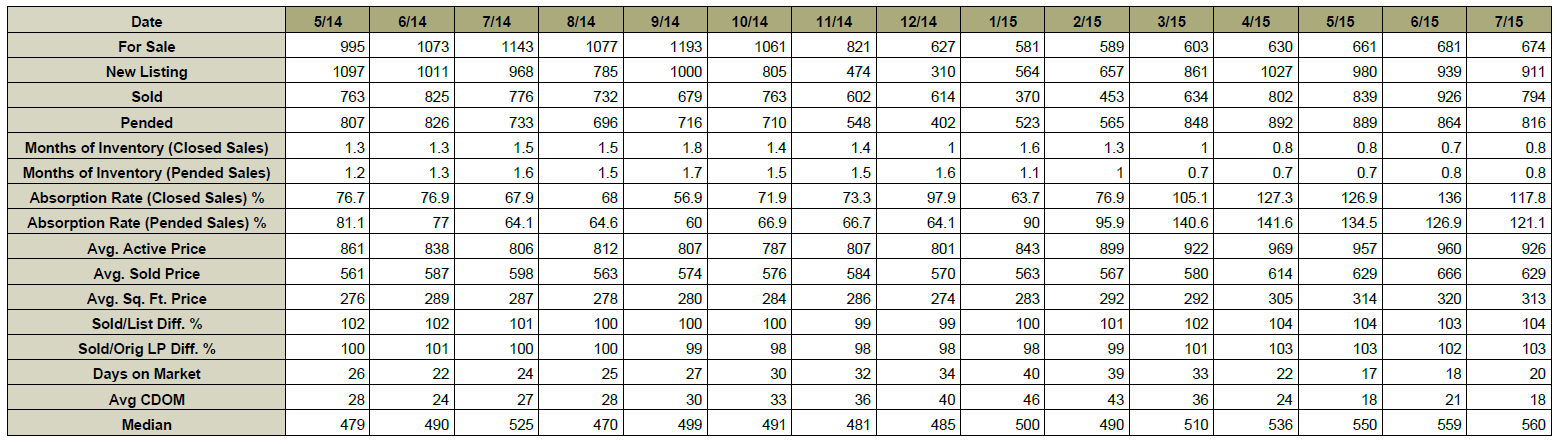
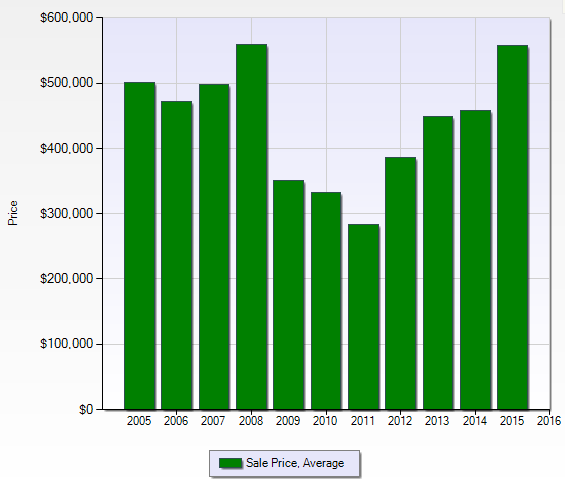
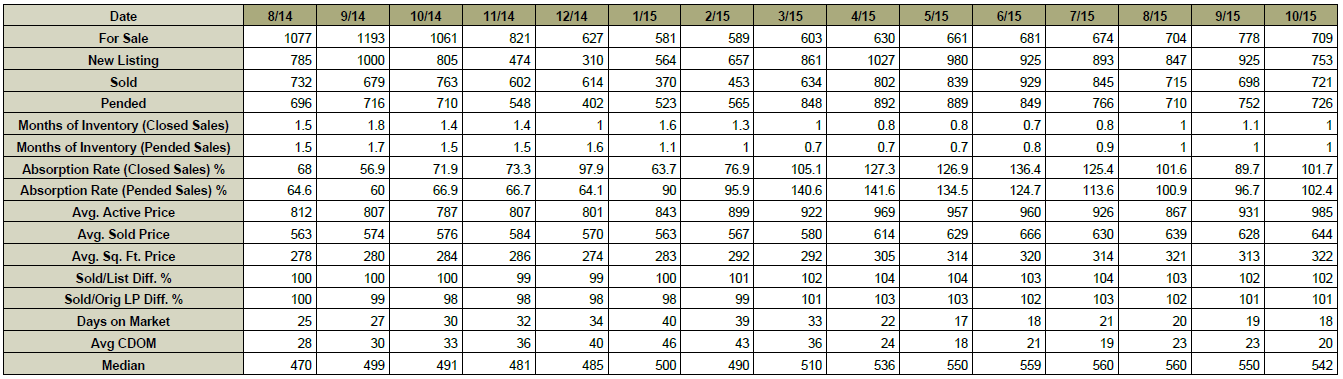
The median price of a Seattle home is at $542,000. The median price of a Seattle home has remained relatively constant over the past 6 months:
May 2015 = $550,000
June 2015 = $559,000
July 2015 = $560,000
August 2015 = $560,000
September 2015 = $551,000
October 2015 = $542,000
However, the median price is up 10% vs October 2014 when the median price was $491,000.
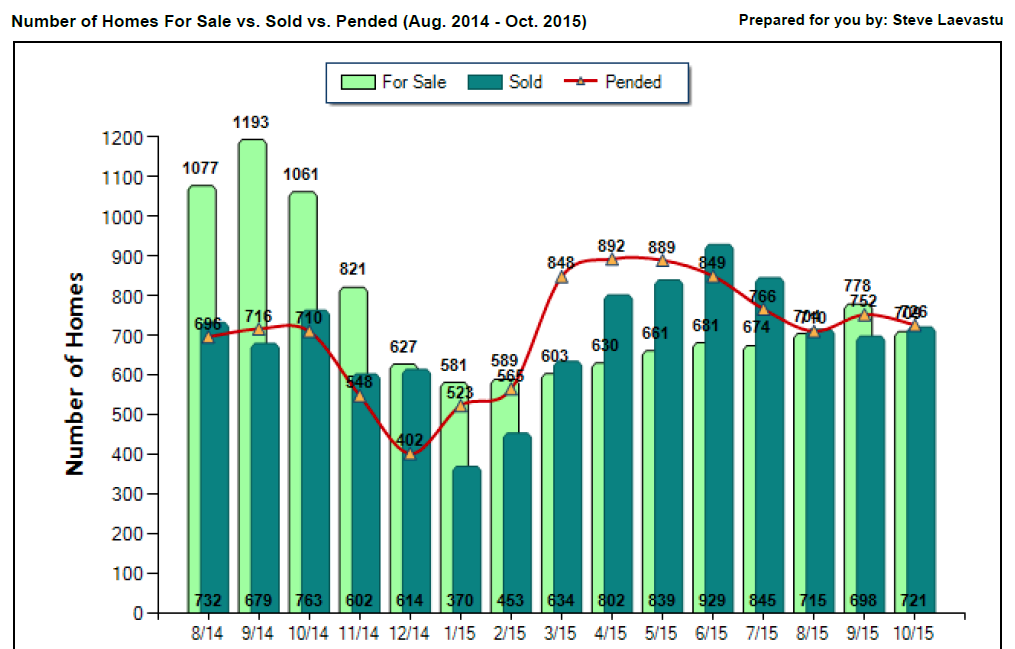
There were 726 pending sales in October, which is up 2% from twelve months ago when 710 pending sales were reported.
SO WHAT HAPPENED TO SEATTLE REAL ESTATE IN OCTOBER?
In October there were 709 ACTIVE listings in the Seattle real estate market.
In October 726 homes went PENDING.
Which means that 1 out of every 0.97 homes on the market went pending in October.
This 0.97 ratio implies a 0.97 month supply of inventory.
The 0.97 ratio is a strong SELLER’S MARKET INDICATOR.
THE PAST 10 MONTHS HAVE SEEN THE BEST SELLER RATIOS EVER FOR SEATTLE ABSORPTON RATE.
Any ratio under 3.0 is a seller’s market indicator.
Any ratio between 3.0 and 6.0 is a neutral market indicator.
Any ratio over 6.0 is a buyer’s market indicator.
The story remains LACK OF INVENTORY.
In October there were 709 ACTIVE listings in Seattle.
The 709 ACTIVE listings is 63% under our 10 year average for October inventory.
Another way of looking at it is that we are only at 37% of our average inventory for this time of year.
THE 709 ACTIVE listings is the 10th lowest month ever recorded. Slightly higher than the all time low which was set 10 months ago (January 2015) with 581.
Needless to say, the 709 ACTIVE October listings is the lowest number ever recorded for October in Seattle.
The October ten year moving average for inventory is 1,916 ACTIVE listings.
Also if we compare October 2015 to October 2014 we will note that even though inventory was low in October 2014 (1,061) it was even lower in October 2015 (709). Inventory is down 34% vs 2014.
In the month of October the AVERAGE list price vs sales price for Seattle was 102%.
So the average home sold for 2% over the asking price.
This is the 9th month in a row that the AVERAGE list price vs AVERAGE sales price has been over 100%
The AVERAGE days on market for a Seattle home was 18 days before they accepted an offer.
The 18 days on the market is the 2nd lowest of all time. The lowest is 17 days on the market which occurred in May 2015.
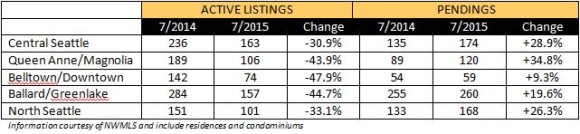
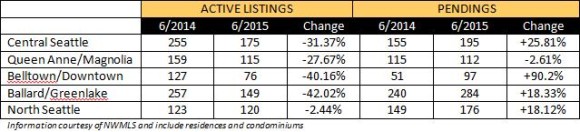
And real estate is always LOCALIZED. What I mean is that CERTAIN areas are moving better than other areas. Let’s take a look at list price vs sales prices for some different neighborhoods in Seattle for the month of October
- Madrona 118%
- Lake City 110%
- Green Lake 105%
- Ballard 105%
- Wedgwood 104%
- Capitol Hill 104%
- Montlake 103%
- Ravenna 103%
- Magnolia 103%
- West Seattle 103%
- View Ridge & Hawthorne Hills 102%
- Laurelhurst 102%
- Queen Anne 99%
- Seward Park 97%
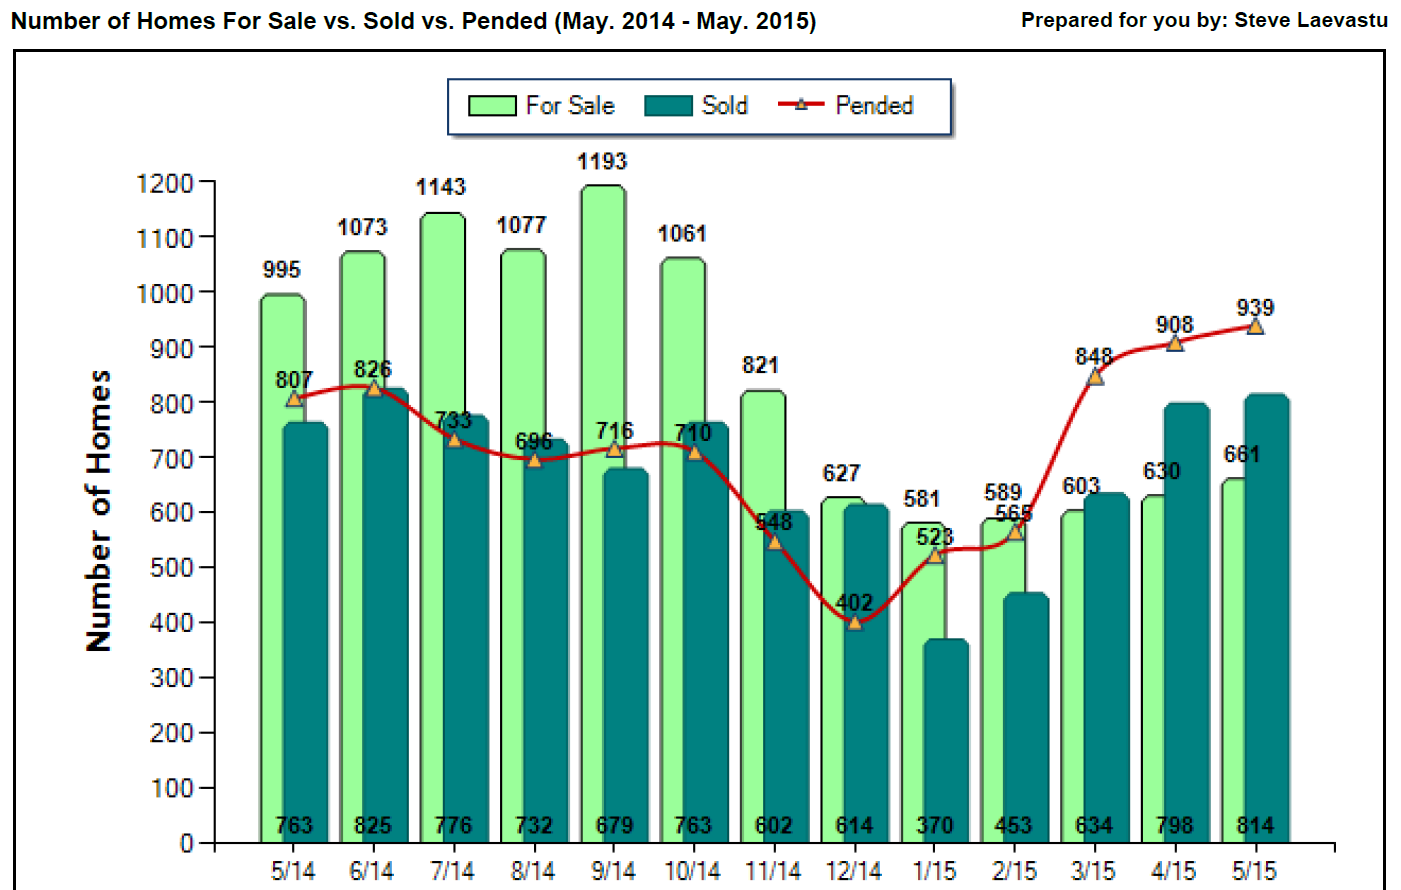
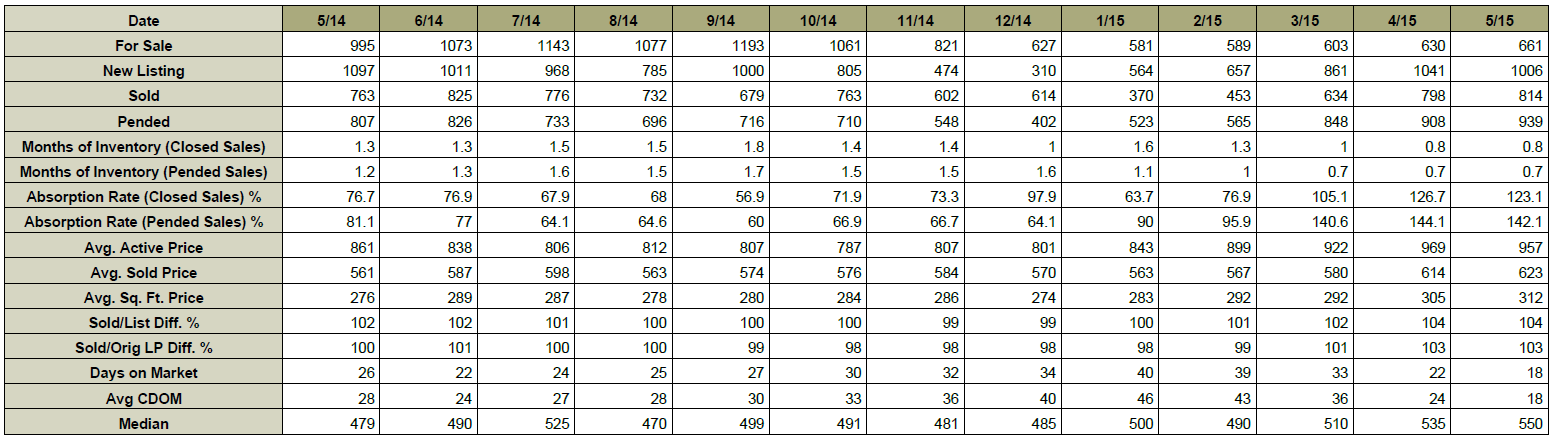
THE CHART AND GRAPH BELOW ARE REAL ESTATE STATISTICS FOR THE CITY OF SEATTLE.
If you have any questions or if I can be of any assistance please contact me.
Thank you,
Steve Laevastu
cell 206-226-5300
sold@windermere.com