Link Light Rail Affects Real Estate Prices

It can be tough to get around in Seattle and on the Eastside. As we add hundreds of people per week to our expanding city, and even more to the whole area, the problem is not going to go away anytime soon. More-flexible work schedules and people working from home will certainly help, but in the coming years, as Link light rail expands, the value of properties around those light rail stops were expected to go up. But now there is a study that substantiates that!

Continue reading

The Future of Puget Sound Area Traffic

Sound Transit has put forth an ambitious plan, called the Sound Transit 3 Plan, to extend Light Rail service throughout the Puget Sound area. The plan is currently receiving public feedback from a number of neighborhood meetings being held throughout the different neighborhoods that will be affected. The finalized plan may be on the ballot in November. All residents (not just homeowners – renters too!) need to be aware of the expansion plan, the timeline, and the bottom line. I encourage you to go to one of the live meetings if you are able to do so. Continue reading

No Bubble for Seattle Real Estate Market

With median sales prices continuing to rise (median sales prices for Seattle residential in February were 26.3% over February 2015 and 38.9% over February 2014). There is speculation about a bubble developing in the real estate market with over-inflated prices that are going to pop. Continue reading

January 2016 Seattle Real Estate Update – Another record breaking month

SEATTLE HOUSING MARKET UPDATE


January 2016 was another RECORD SETTING MONTH FOR SEATTLE REAL ESTATE!!!


The median price of a Seattle home is now $585,000.  This is a new record.

The old record was set back in November 2015 at $576,000.

The median price of a Seattle home is up 17% vs January  2015.

There were 442 pending sales in January, which is down 15% from twelve months ago when 523 pending sales were reported.  The reason pending sales were down is because there is no inventory out there to sell.


SO WHAT HAPPENED TO SEATTLE REAL ESTATE IN JANUARY?

In January there were 456 ACTIVE listings in the Seattle real estate market.

In January 442 homes went PENDING.

Which means that 1 out of every 1.03 homes on the market went pending in January.

This 1.03 ratio implies a 1.03 month supply of inventory.

The 1.03 ratio is a strong SELLER’S MARKET INDICATOR.

THE PAST 13 MONTHS HAVE SEEN THE BEST SELLER  RATIOS EVER FOR SEATTLE ABSORPTON RATE.


Any ratio under 3.0 is a seller’s market indicator.

Any ratio between 3.0 and 6.0 is a neutral market indicator.

Any ratio over 6.0 is a buyer’s market indicator.


The story remains LACK OF INVENTORY.

EPIC RECORD SETTING LOW INVENTORY!!!

In January there were 456 ACTIVE listings in Seattle.

The 456 ACTIVE LISTINGS IS THE SECOND LOWEST NUMBER EVER RECORDED. 

The record low was set last month (December 2015) with 361 ACTIVE listings.

The 456 ACTIVE listings is 67% under our 10 year average for January inventory.

Another way of looking at it is that we are only at 33% of our average inventory for this time of year.

The January ten year moving average for inventory is 1,381 ACTIVE listings.

Also if we compare January 2016 to January 2015 we will note that even though inventory was low in January 2015 (581) it was even lower in January 2016 (456). Inventory is down 22% vs 2015.


In the month of January the AVERAGE list price vs sales price for Seattle was 101%.

So the average home sold for 1% over the asking price.

This is the 12th month in a row that the AVERAGE list price vs AVERAGE sales price has been over 100%


The AVERAGE days on market for a Seattle home was 26 days before they accepted an offer.


And real estate is always LOCALIZED.  What I mean is that CERTAIN areas are moving better than other areas.  Let’s take a look at list price vs sales prices for some different neighborhoods in Seattle for the month of January

  • Montlake 109%
  • Maple Leaf 107%
  • Madrona 107%
  • Green Lake 106%
  • Ravenna 105%
  • Wallingford 104%
  • Ballard 103%
  • West Seattle 103%
  • Capitol Hill 102%
  • View Ridge and Hawthorne Hills 101%
  • Magnolia 101%
  • Wedgwood 101%
  • Bryant 98%
  • Lake City 98%
  • Seward Park 94%
  • Laurelhurst zero closed sales in January


THE CHART AND GRAPH BELOW ARE REAL ESTATE STATISTICS FOR THE CITY OF SEATTLE.

Graph_Feb_11th_2016


Chart_Feb_11th_2016

If you have any questions or if I can be of any assistance please contact me.


Thank you,

Steve Laevastu

cell 206-226-5300

sold@windermere.com


Seattle Housing Market – July Sets New Seattle Median Sales Price Record $560,000

SEATTLE HOUSING MARKET UPDATE


July 2015 set more records for Seattle real estate!


The new report summarizing July activity shows year-over-year gains in pending sales, and prices.


The median price of a Seattle home is now A NEW ALL TIME RECORD $560,000 which is up 9% from one year ago when the median price of a Seattle home was $525,000.


There were 816 pending sales in July, which is up 11% from twelve months ago when 733 pending sales were reported.


SO WHAT HAPPENED TO SEATTLE REAL ESTATE IN JULY?


In July there were 674 ACTIVE listings in the Seattle real estate market.


In July 816 homes went PENDING.


Which means that 1 out of every 0.8 homes on the market went pending in June.


This 0.8 ratio implies a 0.8 month supply of inventory.


The 0.8 ratio is a strong SELLER’S MARKET INDICATOR.

THE PAST 7 MONTHS HAVE SEEN THE BEST SELLER  RATIOS EVER FOR SEATTLE ABSORPTION RATE.


Any ratio under 3.0 is a seller’s market indicator.

Any ratio between 3.0 and 6.0 is a neutral market indicator.

Any ratio over 6.0 is a buyer’s market indicator.


The story remains LACK OF INVENTORY.


In July there were 681 ACTIVE listings in Seattle.

The 674 ACTIVE listings is 65% under our 10 year average for July inventory.

Another way of looking at it is that we are only at 35% of our average inventory for this time of year.

THE 674 ACTIVE listings is the 8th lowest month ever recorded. Slightly higher than the all time low which was set 7 months ago (January 2015) with 581.

Needless to say, the 674 ACTIVE July listings is the lowest number ever recorded for JULY in Seattle.

The July ten year moving average for inventory is 1,944 ACTIVE listings.

Also if we compare July 2015 to July 2014 we will note that even though inventory was low in July 2014 (1143) it was even lower in July 2015 (674). Inventory is down 41% vs 2014.

In the month of July the AVERAGE list price vs sales price for Seattle was 104%.

So the average home sold for 4% over the asking price.

This is the 6th month in a row that the AVERAGE list price vs AVERAGE sales price has been over 100%


And real estate is always LOCALIZED.  What I mean is that CERTAIN areas are moving better than other areas.  Let’s take a look at list price vs sales prices for some different neighborhoods in Seattle for the month of July


  • Ravenna 109%
  • Wedgwood 106%
  • Laurelhurst 106%
  • Madrona 106%
  • Green Lake 105%
  • Ballard 105%
  • Beacon Hill 105%
  • View Ridge & Hawthorne Hills 104%
  • Montlake 104%
  • Lake City 104%
  • Queen Anne 103%
  • Magnolia 103%
  • Seward Park 103%
  • Capitol Hill 103%
  • West Seattle 102%


THE CHART AND GRAPH BELOW ARE REAL ESTATE STATISTICS FOR THE CITY OF SEATTLE.


July_Graph


July_chart


If you have any questions or if I can be of any assistance please contact me.


Thank you,


Steve Laevastu


cell 206-226-5300


sold@windermere.com


Seattle Median Sales Price Sets NEW RECORD IN MAY!

SEATTLE HOUSING MARKET UPDATE


May 2015 set more records for Seattle real estate!


The new report summarizing May activity shows year-over-year gains in pending sales, and prices.


The median price of a Seattle home is now A NEW ALL TIME RECORD $550,000 which is up 15% from one year ago when the median price of a Seattle home was $479,000.


There were 939 pending sales in May, which is up 16% from twelve months ago when 807 pending sales were reported.


SO WHAT HAPPENED TO SEATTLE REAL ESTATE IN MAY?

In May there were 661 ACTIVE listings in the Seattle real estate market.

In May 939 homes went PENDING.

Which means that 1 out of every 0.7039 homes on the market went pending in May.

This 0.7039 ratio implies a 0.7039 month supply of inventory.

The 0.7039 ratio is a strong SELLER’S MARKET INDICATOR.

THE PAST 4 MONTHS HAVE SEEN THE BEST SELLER  RATIOS EVER FOR SEATTLE ABSORPTON RATE.


Any ratio under 3.0 is a seller’s market indicator.

Any ratio between 3.0 and 6.0 is a neutral market indicator.

Any ratio over 6.0 is a buyer’s market indicator.


The story remains LACK OF INVENTORY.

In May there were 661 ACTIVE listings in Seattle.

The 661 ACTIVE listings is 64% under our 10 year average for May inventory.

Another way of looking at it is that we are only at 36% of our average inventory for this time of year.

THE 661 ACTIVE listings is the 5th lowest month ever. Slightly higher than the all time low which was set five months ago (January 2015) with 581.

The May ten year moving average for inventory is 1,828 ACTIVE listings.


Also if we compare May 2015 to May 2014 we will note that even though inventory was low in May 2014 (995) it was even lower in May 2015 (661). Inventory is down 33% vs 2015.


In the month of May  the AVERAGE list price vs sales price for Seattle was 104%.

So the average home sold for 4% over the asking price.

The 104% list price vs sales for Seattle TIED THE RECORD!!!

The 104% record was originally set last month (April 2015).

The past 2 months in a row have seen the average list price vs sales price in Seattle at 104%


And real estate is always LOCALIZED.  What I mean is that CERTAIN areas are moving better than other areas.  Let’s take a look at list price vs sales prices for some different neighborhoods in Seattle for the month of May


  • Wedgwood 113%
  • Ravenna 113%
  • Green Lake 107%
  • Capitol Hill 106%
  • Montlake 105%
  • Ballard 105%
  • View Ridge & Hawthorne Hills 104%
  • West Seattle 104%
  • Queen Anne 103%
  • Magnolia 102%
  • Beacon Hill 102%
  • Seward Park 102%
  • Lake City 101%
  • Laurelhurst 100%
  • Madrona 97%


THE CHART AND GRAPH BELOW ARE REAL ESTATE STATISTICS FOR THE CITY OF SEATTLE.


June_2011_Graph


June_2015_chart


If you have any questions or if I can be of any assistance please contact me.


Thank you,

Steve Laevastu

cell 206-226-5300

sold@windermere.com

Amazon Set to Lease More Office Space in Downtown Seattle

According to the Seattle Times, Amazon has leased a full city block in South Lake Union which was originally occupied by Troy Block. This is a two building development with 817,000 total square footage leased. The first of these two buildings will be open in 2016 and the other in 2017. The total square footage occupied by Amazon could accommodate 50,000 employees which would make Amazon the largest employer in Seattle.

While there are some concerns about Amazon occupying 25% of Seattle’s available inventory of premium office space, I would like to focus on what this could mean for our local real estate market.

As you probably are aware, we have a shortage of available homes in our Seattle real estate market. There is a shortage of condos, residences, and rentals causing rental rates to increase excessively. There are some apartment buildings in the area that are renting apartments in excess of $4,000 per month for a two bedroom apartment just over 1,000 square feet. The City of Seattle and King County have turned density and growth into hot, highly debatable, topics. Unless we allow for areas of higher density, house prices are going to continue to rise, causing would-be workers to be priced out of the urban core due to high rents or housing prices.

The second hot topic is transportation. Sound Transit and Light Rail are going to be a part of our long-term solution for dealing with the increase in traffic that more jobs in the Downtown core creates. Although I mentioned Amazon earlier, Facebook is also expanding Downtown according to Geekwire, along with Zillow, Twitter, Tableau, and Google which means more employees at these companies as well.

What do homeowners and would-be homeowners need to know? If you are renting, please talk to a real estate agent about what the next five years could look like for you in terms of rent versus your purchasing a home or a condo. There may be loan programs available that will allow you to purchase property with a lower down payment than you expected.

I will be keeping an eye on what Seattle and King County are doing to handle the density problem which could affect homeowners in our area. In other cities where additional dwellings are allowed on a city lot, the value of those lots have gone up significantly. I will be sure to keep you in the loop if something like that comes to the Seattle real estate market! In the meantime, please contact me with any questions you have about our local housing market: (206) 226-5300 or email sold@windermere.com.

Multitudes of Millennials in Position to Purchase in Seattle Metro Area

According to the National Association of REALTORS® the Seattle Metro Area is one of the top ten markets in the country with the Millennial generation poised to lead the charge of first time homebuyers. Seattle, along with metros such as Austin, Dallas, Denver, Des Moines (Iowa), Grand Rapids (Michigan), New Orleans, Ogden, and Salt Lake City have strong job markets with jobs that appeal to this generation and the demand for housing hasn’t priced first time homebuyers out of the market like in New York, Los Angeles, and San Francisco.

According to NAR Chief Economist, Lawrence Yun, “NAR research finds that there are…metro areas millennials are moving to where job growth is strong and home ownership is more attainable. These markets are well-positioned to soon experience a rise in first-time buyers as the economy improves.”

The homeownership rate for young adults (under the age of 35) was 43% in 2005 (the peak) and the rate has fallen from that peak to 36% in the first quarter of 2014.

NAR measured current housing conditions, housing affordability (measured by incomes, interest rates and median home prices), job creation, and population trends across the country in metro areas that have a large millennial presence. NAR expects that as life events present themselves (marriage, kids) millennials will want to settle down and purchase a home rather than rent and live in close quarter. As long as market conditions hold and affordability is maintained, millennials are poised to be our next wave of first time homebuyers.

What does this mean for current homeowners? I expect demand will continue to be strong in our region as job growth is strong in our region. Over the next few years, if you own a home with market value under about $400,000, I expect that price point to increase in demand unless our builders complete new homes to meet that growing need. If you have questions for me or would like to learn more, please give me a call or send me an email: (206) 226-5300 or sold@windermere.com.

Seattle Housing Market Stats For August 10% Seattle Price Drop???

SEATTLE HOUSING MARKET UPDATE


Last month I reported that the median price of a Seattle home reached a NEW ALL TIME RECORD. The median price for July was $525,000.


In August 2014 the median price of a Seattle home took a SUBSTANTIAL drop to $475,000.

SO did home prices drop 10% in from July to August?


Please also note that the median price for a Seattle home in June 2014 was $489,000. June Seattle median home price = $490,000 July Seattle median home price = $525,000 August Seattle median home price = $475,000


So how does the median price of a Seattle home increase by $35,000 or over 7% in just one month?? And then drop by $50,000 (10%) the next month?

ANSWER = This is a statistical anomaly.  Every now and then you will see big jumps month over month in Seattle median price or Seattle average prices only to come back closer to the mean the following month.
In this case JULY 2014 is the OUTLIER that we should not pay close attention to.


Instead let’s focus on August 2013 median price of  $450,000 and the August 2014 median price of $475,000 which means the median price of a Seattle home has increased 6% year over year.


SO WHAT HAPPENED TO SEATTLE REAL ESTATE IN AUGUST?


Well, August was another great month for sellers.

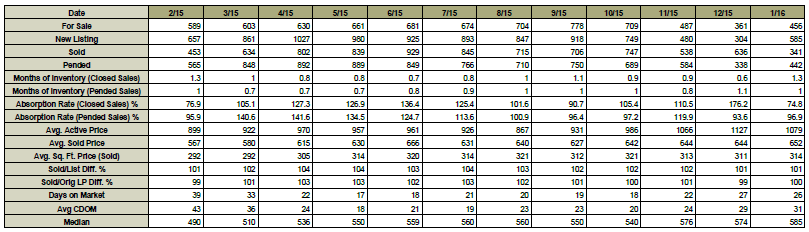
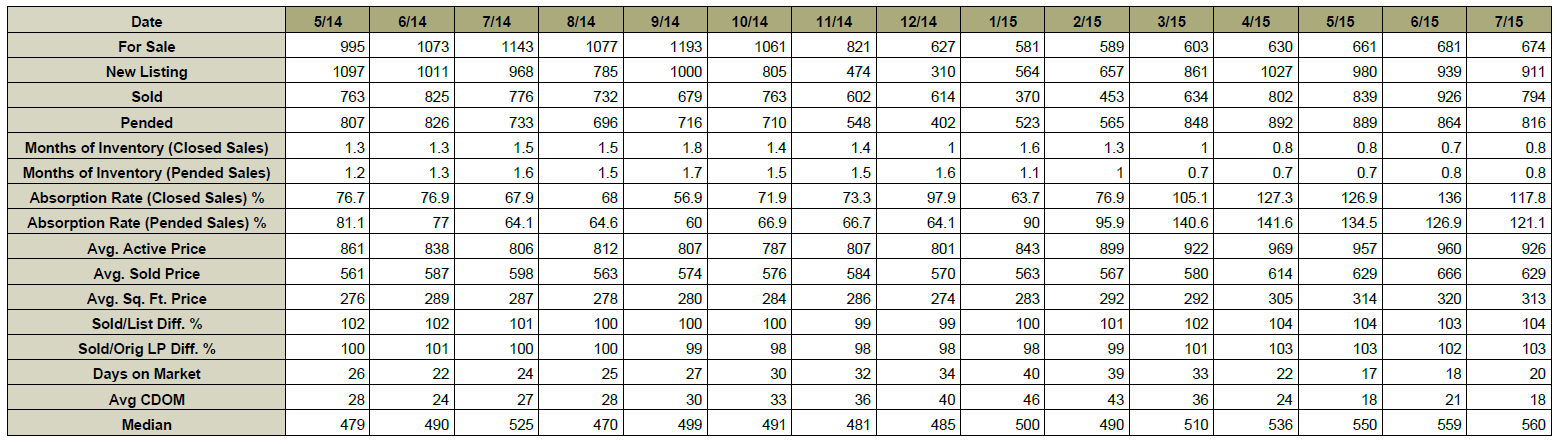
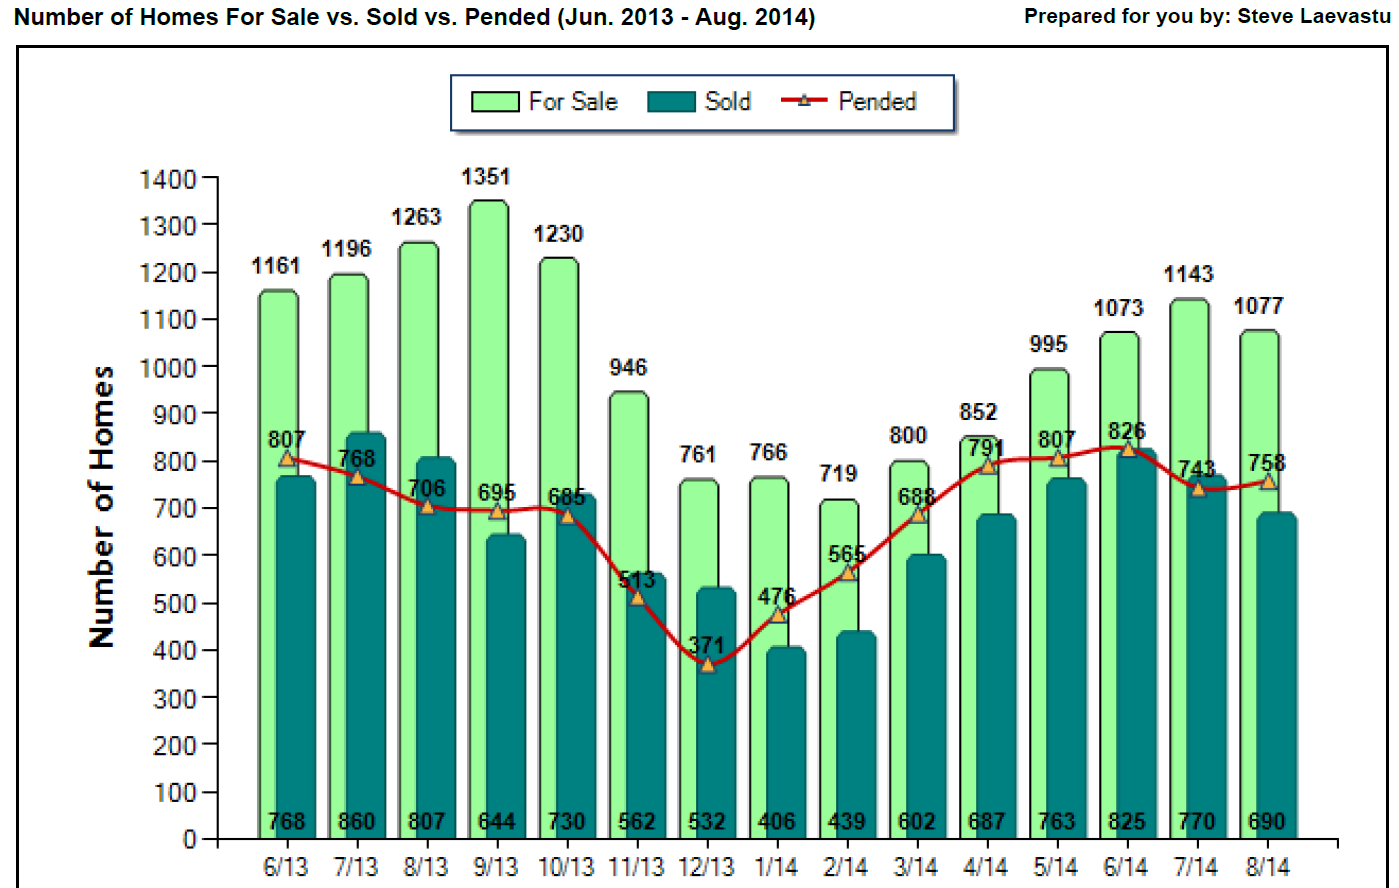
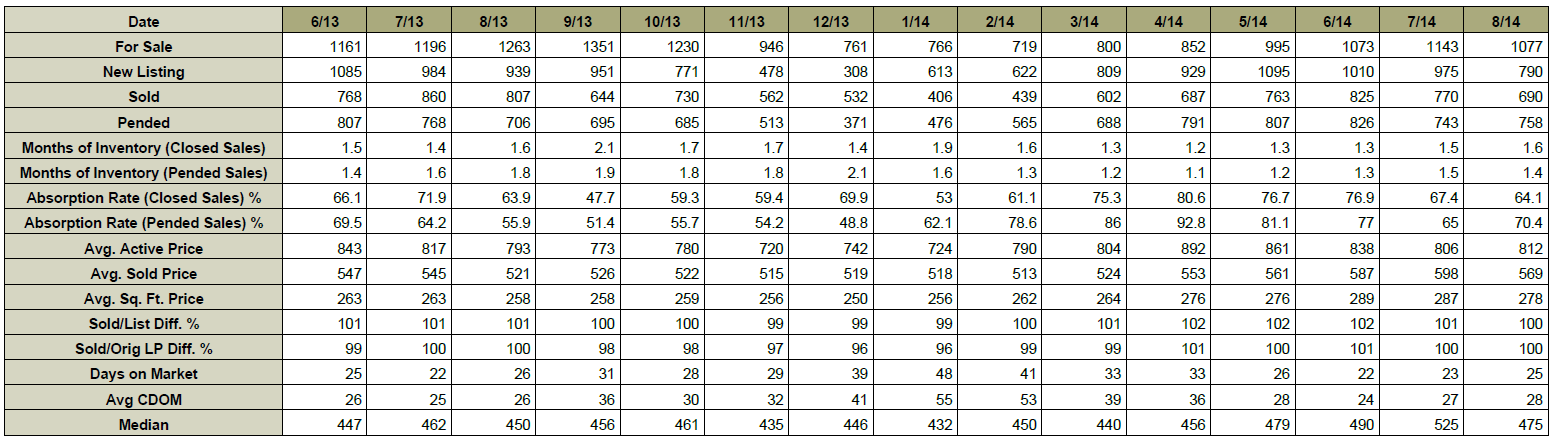
In August there were 1,077 ACTIVE listings in the Seattle real estate market.

In August 758 homes went PENDING.

Which means that 1 out of every 1.4 homes on the market went pending in August.

This 1.4 ratio implies a 1.4 month supply of inventory.

The 1.4 ratio is a strong SELLER’S MARKET INDICATOR.


Any ratio under 3.0 is a seller’s market indicator.

Any ratio between 3.0 and 6.0 is a neutral market indicator.

Any ratio over 6.0 is a buyer’s market indicator.


The story remains LACK OF INVENTORY.

The 1,077 ACTIVE listings is 46% under our 10 year average for August inventory.

The August ten year moving average for inventory is 1,979 ACTIVE listings.


Also please note that August was the 7th month in a row that the AVERAGE list price vs SALES price was 100% or more.

In the month of August the list price vs sales price was 100%.


WHAT TO EXPECT IN SEPTEMBER?


I expect September to be a stronger month than August.

This is because many agents and buyers vacation in August.

The real estate agents that were on vacation in August come back to work in September and buyers come back from their vacation.

Interest rates which are at historic low rates of approximately 4% are very attractive to buyers.

And the Seattle economy is very strong and diverse with unemployment levels hovering around 4%.

The activity in my office has been very strong since Labor Day (lots of activity and buzz in the office).


Therefore due to all of the above factors I expect September to be stronger than August.


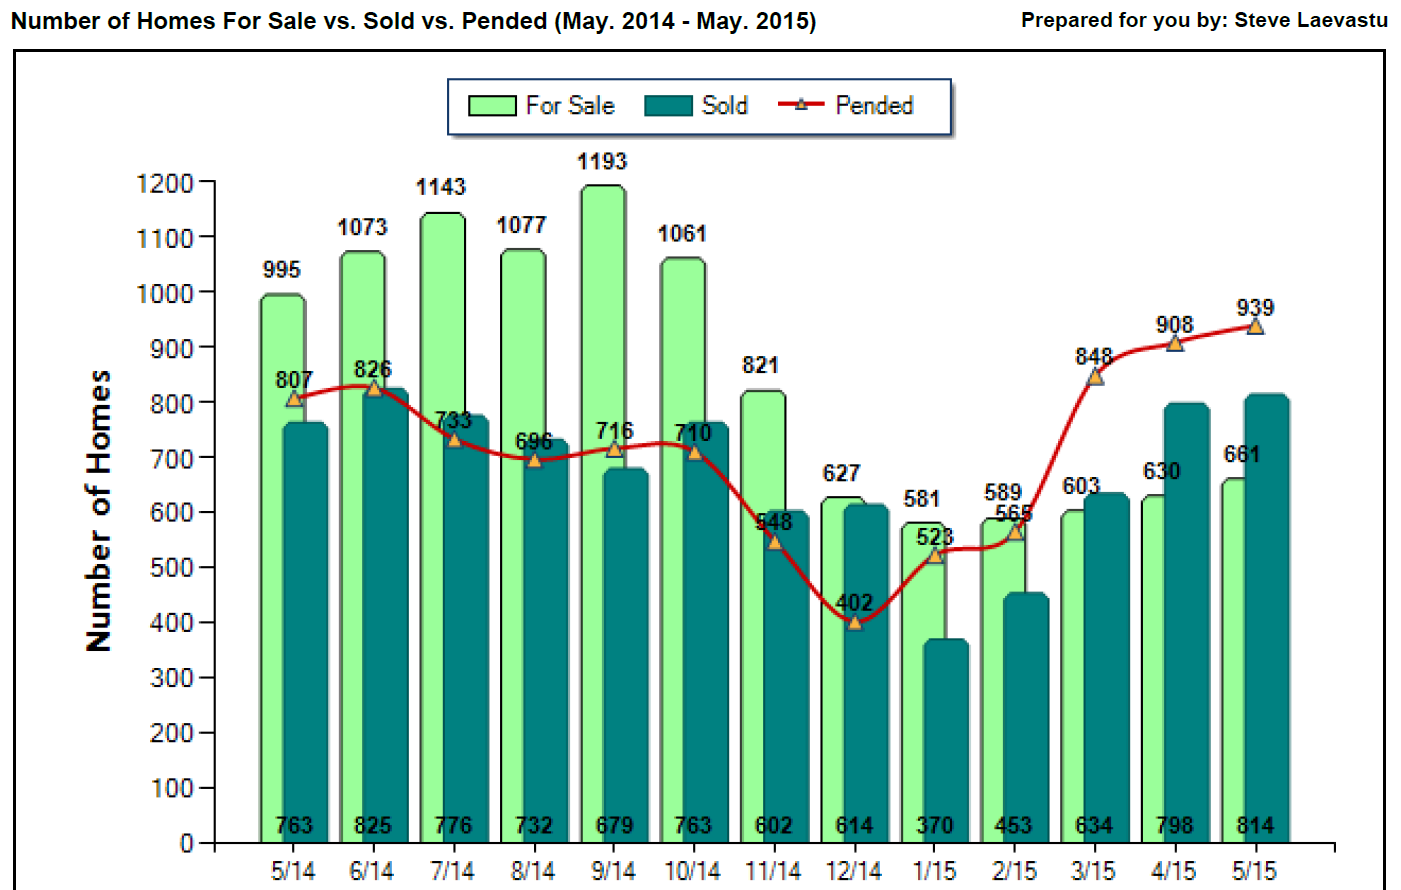
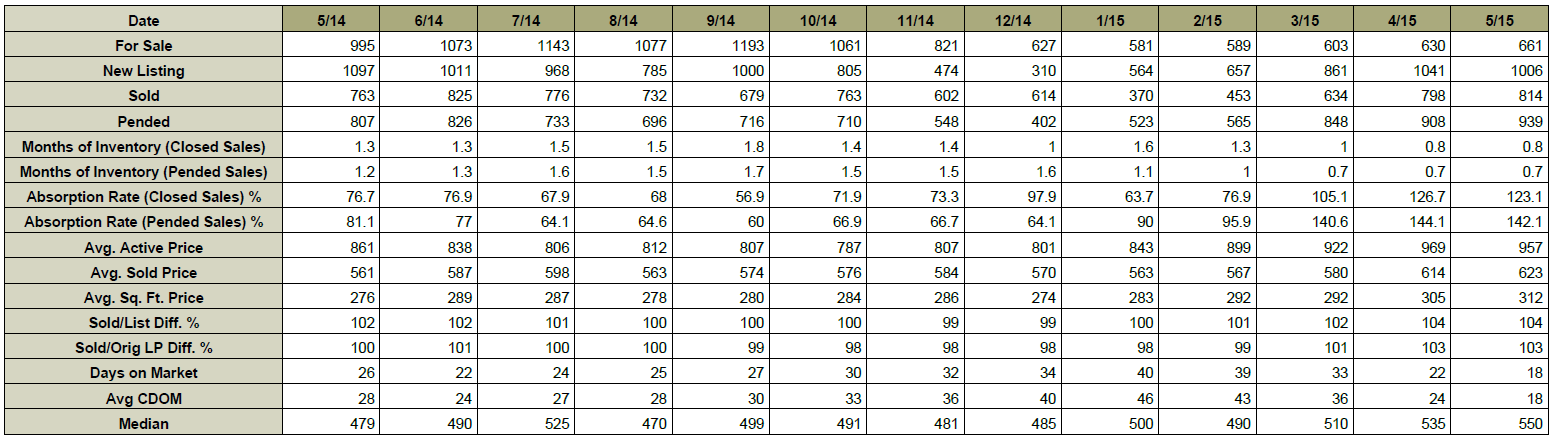
PLEASE VIEW THE GRAPH AND DATA BELOW

August_2014_GraphAugust_2014_Chart
If you have any questions or if I can be of any assistance please contact me.

Thank you,

Steve Laevastu

cell 206-226-5300

sold@windermere.com

www.SeattleHomeGuy.com

Walkability: A New Way To Look At Real Estate

If a move is in your future and you are looking for a location with easy access to mass transit, shopping, services, and bike trails, I use a tool in my business that provides buyers and homeowners with a “Walkability” analysis score. This feature has been very helpful for a number of my clients who want a true urban lifestyle with easy access.

According to the Puget Sound Business Journal, Seattle has ranked as the 6th “high walkable urbanism” area in the US after Washington DC, New York, Boston, San Francisco, and Chicago based on urban development based on a report, Foot Traffic Ahead: Ranking Walkable Urbanism in America’s Largest Metros put out by the Center for Real Estate and Urban Analysis at George Washington University School of Business.

Walkscore.com measures similar variables such as proximity to grocery stores, transit, and access to bike routes and provides a score for each address. Walkscore.com ranks Seattle as a whole as a “71” – meaning that most errands can be accomplished on foot. However, let’s take a closer look at Downtown Seattle, listed as the most walkable neighborhood in Seattle. It has a Walkscore of 98 with a Transit score of 100 and a Bike score of 66.

I have listings in a number of neighborhoods in Seattle. Here is how they measure up on Walkscore.com:

1606 NE 75th St in Ravenna:

  • Walk Score: 72 – Very Walkable
  • Transit Score: 52 – Good Transit
  • Bike Score: 72 – Very Bikeable

11038 Fremont Ave N in Broadview:

  • Walk Score: 60 – Somewhat Walkable
  • Transit Score: 50 – Good Transit
  • Bike Score: 57 –Bikeable

8008 Meridian Ave N in Greenlake:

  • Walk Score: 58 – Somewhat Walkable
  • Transit Score: 50 – Good Transit
  • Bike Score: 63 – Bikeable

How does your property stack up in terms of walkability? Type in your address at: http://www.walkscore.com/

If you have questions about how walkability impacts your home value, please contact me: (206) 226-5300 or sold@windermere.com.