Although the groundhog predicted six more weeks of winter, the Seattle real estate market is hopping like it is spring. Check out the market trends below.
Inventory of Listings
We are starting the year once again with a shortage of inventory in many of our Seattle neighborhoods. Since there are buyers in the market right at this moment, I see this as a window of opportunity for sellers before spring to sell before additional competition comes on the market and interest rates begin to creep up which will limit some buyers. Of course, whether the time is right for you to make a move will depend on a variety of factors including where you want to move to. If you are considering a move, please schedule a meeting with me as soon as possible to explore your options.
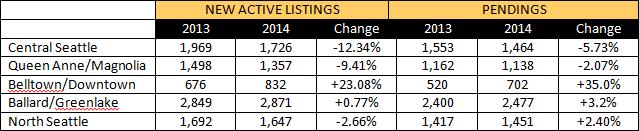
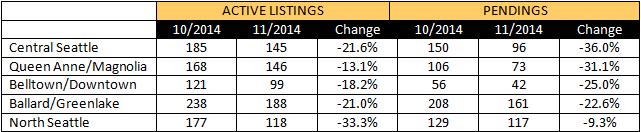
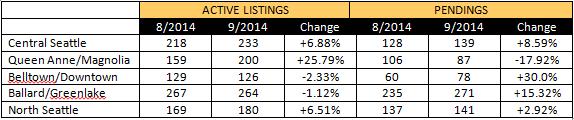
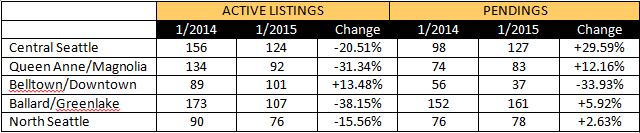
Below is a table comparing the number of active listings (supply) and pendings (demand) for several of our Seattle neighborhoods (these numbers include single family residences as well as condos). We are looking at January 2014 versus January 2015:
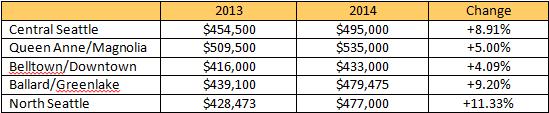
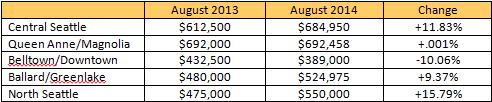
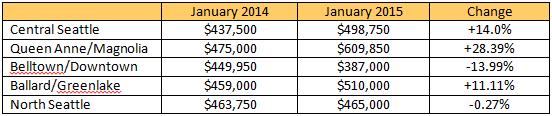
Median Sales Prices
As a result of this low inventory, prices are up year over year in most neighborhoods. Check out Queen Anne / Magnolia with a 28% increase! However, with the inventory numbers above, there is bound to be increased demand. The opposite is currently true in Belltown / Downtown. The number of active listings has increased, and pendings have decreased. Prices seem to be adjusting accordingly, but it will be interesting to note if this is an ongoing trend.
Want to learn more about what our 2015 market means for your real estate investment goals? Contact me at sold@windermere.com or give me a call: (206) 226-5300.