Could Rent Control be coming to Seattle?

According to the National Association of REALTORS®, over the last five years in the Seattle Metro area, rents have increased a whopping 22.26% between whereas wages for 25-44 year olds (which comprise a good number of renters) only increased 15.3%. This time period reviewed was quarter 3 2009 to quarter 3 2014 for the rents whereas wages were reviewed 2009-2014. According to Dupre+Scott Apartment Advisors, that number is even more staggering when looking only at Seattle and since spring of 2013 – 18% higher.

This disparity along with comparisons to tech-driven job markets such as San Francisco have many wondering if Seattle could be the next city to jump on the rent control bandwagon.

According to the Puget Sound Business Journal, there was a town meeting at City Hall on April 23rd to discuss this hot topic and Mayor Ed Murray has even created a housing affordability task force to tackle the problem. The hurdle is a big one – rent control is currently illegal in Washington State.

Seattle Magazine reports that renters make up 52% of Seattle’s population, so the effects of such a law – or not passing a law – will be felt by the majority of Seattle’s residents. With the average market rent for a one bedroom, one bathroom apartment in the city of Seattle going for $1,445 per month, there are a number of renters and would-be renters who are going to have to start finding housing further away from the city center.

People for rent control point to issues like transportation that become a bigger challenge when workers cannot afford to live near where they work and have to commute in. However, those who oppose it indicate that rent control will hamper development and reinvestment in the buildings that may be in need of updating.

Whether you are a proponent of rent control or not, this debate and rent increases are driving some to turn to home ownership, even with the inventory shortages that challenging the real estate market.

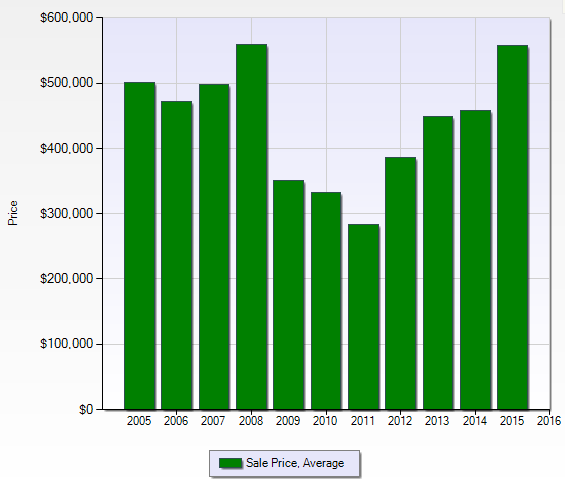
However, the economics of it make sense. If you are paying $3,000 per month for a three bedroom apartment in Capitol Hill and you can buy a 3 bedroom home in Wallingford for $600,000 (even taking into account multiple offers driving up the price from $500,000 to $600,000), depending on your down payment, that mortgage and principle may only come to $2,300 per month. Add taxes and insurance on there and you might be at $2,800 per month.  Remember, this is just an estimation, and prices vary, but if you are pounding your fist, hoping rent control is passed before your landlord decides to raise the rent again, you owe it to yourself to take a look at home ownership.

And remember! If you have a 30 year fixed rate mortgage, your monthly mortgage payment is your monthly mortgage payment – next year and 25 years down the road. Furthermore, you are building equity which could mean money in your pocket when you are ready to sell. Try doing that while renting!

I would be happy to give you additional information on how to make your housing dollars go further. Give me a call: (206) 226-5300 or send an email to: sold@windermere.com!

Seattle Average House Price – Depends On How You Look At The Stats!

Below is the graph and chart for the AVERAGE Seattle house price over the past 10 years

Seattle_10_Year_Avg Graph


Seattle_10_Year_Avg_Chart


Now there are many ways you can interpret this data and graph.


  • The average Seattle home price through the first 3 months of 2015 is $558,033
  • The average Seattle home price is up 21% vs 2014.
  • The average Seattle home price from 2013 to 2014 increased only 2%
  • The average Seattle home price over the past 10 years has increased 11%. So only an average of 1% a year since 2005.
  • The average Seattle home price has increased 96% since 2011. Or 24% a year since 2011.
  • The average Seattle home price is virtually the same as it was since 2008. Therefore we have not seen any appreciation since 2008 – However, a lot has happened since then!!


Seattle Real Estate Trends, March 2015

The Seattle area’s inventory challenges are continuing as we finish out the first quarter. This real estate market is allowing sellers to sell for top dollar as long as they are priced at market when they list. There are also opportunities for people moving out of the area (even to Snohomish, Pierce, or Kitsap counties and further out) as though inventory is starting to affect those areas as well, the overall demand is not as high as it is in Seattle.

Here is a closer look at what is happening in Seattle and some key neighborhoods:

Inventory and Pendings

Seattle’s overall inventory has grown by 12 listing since December (859 in December versus 871 in March). In the meantime, pendings have leaped by 538 in December to 1,268 for March. It is unusual to have that number of pendings compared to the total inventory.

Below we compare the number of active listings (supply) and pendings (demand) for several of the key Seattle neighborhoods including Central Seattle, Queen Anne and Magnolia, Belltown and Downtown, Ballard and Greenlake, and North Seattle. Our table includes single family residences as well as condos comparing March 2014 and 2015.

real-estate-trends-2015-03_1

Median Sales Prices

Consistency is the word for March! Just as the above inventory has decreased throughout, pendings have increased, prices have increased as well. Belltown is just beginning to see a comeback after a temporary lull, but pendings have skyrocketed (up 100% over last year) and prices are up a modest 2+%. The price increases in the other areas have seen a much stronger increase.

real-estate-trends-2015-03_2

I would love to talk with you about your real estate investment goals or let you know where your home stands in relation to today’s market. Contact me at sold@windermere.com or give me a call: (206) 226-5300.

Amazon Set to Lease More Office Space in Downtown Seattle

According to the Seattle Times, Amazon has leased a full city block in South Lake Union which was originally occupied by Troy Block. This is a two building development with 817,000 total square footage leased. The first of these two buildings will be open in 2016 and the other in 2017. The total square footage occupied by Amazon could accommodate 50,000 employees which would make Amazon the largest employer in Seattle.

While there are some concerns about Amazon occupying 25% of Seattle’s available inventory of premium office space, I would like to focus on what this could mean for our local real estate market.

As you probably are aware, we have a shortage of available homes in our Seattle real estate market. There is a shortage of condos, residences, and rentals causing rental rates to increase excessively. There are some apartment buildings in the area that are renting apartments in excess of $4,000 per month for a two bedroom apartment just over 1,000 square feet. The City of Seattle and King County have turned density and growth into hot, highly debatable, topics. Unless we allow for areas of higher density, house prices are going to continue to rise, causing would-be workers to be priced out of the urban core due to high rents or housing prices.

The second hot topic is transportation. Sound Transit and Light Rail are going to be a part of our long-term solution for dealing with the increase in traffic that more jobs in the Downtown core creates. Although I mentioned Amazon earlier, Facebook is also expanding Downtown according to Geekwire, along with Zillow, Twitter, Tableau, and Google which means more employees at these companies as well.

What do homeowners and would-be homeowners need to know? If you are renting, please talk to a real estate agent about what the next five years could look like for you in terms of rent versus your purchasing a home or a condo. There may be loan programs available that will allow you to purchase property with a lower down payment than you expected.

I will be keeping an eye on what Seattle and King County are doing to handle the density problem which could affect homeowners in our area. In other cities where additional dwellings are allowed on a city lot, the value of those lots have gone up significantly. I will be sure to keep you in the loop if something like that comes to the Seattle real estate market! In the meantime, please contact me with any questions you have about our local housing market: (206) 226-5300 or email sold@windermere.com.

Seattle Real Estate Trends, February 2015

As Seattle’s spring real estate market gets underway, the lack of available Seattle homes for sale continues to be the leading story:

Inventory and Pendings

In fact, many homes that are coming on the market are getting snapped up very quickly. All of my listings are now pending with an average of only 8 days on market. These listings range from $550,000 to $900,000 and cover Wedgwood, Fremont, Ravenna, and Hawthorne Hills neighborhoods.

Below we compare the number of active listings (supply) and pendings (demand) for several of our Seattle neighborhoods including Central Seattle, Queen Anne and Magnolia, Belltown and Downtown, Ballard, North Seattle and Greenlake neighborhood. Our table includes single family residences as well as condos comparing February 2014 and 2015.seattle-trends-2015-02-1

Median Sales Prices

Although inventory is down throughout the city, we are seeing a mixed bag when it comes to median sales price averages comparing last month to the year before. We have a high of +16.29% in Ballard and Greenlake while we have a 9% decrease in Belltown and Downtown with a variety in-between as inventory adjusts throughout Seattle.

seattle-trends-2015-02-2

I would love to talk with you about your real estate investment goals and help you make a plan, whether that is a five month plan or five years. Contact me at sold@windermere.com or give me a call: (206) 226-5300.

Seattle Real Estate Market Update 2014 Review

2014 was another strong year in our market! Just how strong? Check out the numbers below!

Inventory of Listings

Below is a table comparing the number of NEW active listings (supply) and pendings (demand) for several Seattle neighborhoods: Central Seattle, Queen Anne/Magnolia, Belltown/Downtown, Ballard/Greenlake, and North Seattle (these numbers include single family residences as well as condos):

2014reviewmarketupdate01

In Central Seattle, we saw both a drop in new active inventory along with homes under contract. Queen Anne/Magnolia saw a drop in new active listings along with a small drop in pendings (indicating this is still an area with high demand). Belltown/Downtown saw a large increase in new active listings which were mainly condo based. Inventory was absorbed quickly with Belltown/Downtown sporting both the largest swing in new active listings and new pendings.

Ballard/Greenlake saw both a slight increase in new active listings along with pendings while North Seattle continued its high demand profile with a slight decline in new active listings and a slight increase in pendings.

Median Sales Prices

Median sales prices tell the story even further.  It shouldn’t surprise you to see that median sales prices are up across the board in Seattle, ranging from 4.09% to 11.33%. Below are the median sales price averages for the neighborhoods I track comparing 2013 to 2014. Remember, these prices include both residences and condos.

2014reviewmarketupdate02

Please contact me at sold@windermere.com or give me a call: (206) 226-5300 to learn more about what to expect for 2015!

Urban Growth in Seattle

As we bid farewell to 2014, we can look forward to a continued strong real estate market in Seattle in 2015, driven by not only our strong economy, but also the influx of people wanting to live in the city.

In terms of the job market, Seattle Bellevue Everett Metropolitan Statistical Area unemployment rate is currently at 4.5%, below our ten-year average of 6.1%. In addition to growth in the number of jobs in our area, we are also seeing growth in wages due to the types of jobs we have been adding at companies such as Microsoft, Amazon, and Boeing.  However, retail and construction also had positive growth in the past year.

These companies are attracting young, skilled Millennial workers to our city’s core where companies like Amazon have set up shop. In an interview with Jeff Bezos, he indicated that an urban setting set the stage for the type of culture he sought for the company. NBBJ chairman (an architecture firm), Scott Wyatt, pointed to several reasons why this model works: Urban Seattle is growing faster than the suburbs, people want activities close by and don’t necessarily want to own a vehicle, companies want to foster a collaborative environment with not only employees from their own company, but other companies as well, and an urban setting allows for more physical movement. It is clear that if the Amazon model works, we will continue to see growth in the tech sector in the urban core.

We don’t currently have enough housing to keep up with the housing demand in the urban core, which is why rent rates are increasing at the pace they are as well as median home prices. I expect this will continue to be an issue in 2015 as our city amplifies its efforts to keep up with demand.

For example, according to the Seattle Times, there is a new skyscraper coming to town – a tower to replace the current Rainier Square shopping mall which will include eight stories of luxury apartments as well as 35 floors of offices and ground-floor retail. It sits between Fourth and Fifth avenues and Union and University streets on the site of the original University of Washington. This will be the second-highest skyscraper in the city, behind the Columbia Tower. However, this is still in the planning stages and will not be completed for several years.

These factors point to investment appreciation if you own real estate in Seattle. Our market is strong and all signs point to a robust 2015. Give me a call to learn more: Steve Laevastu: 206-226-5300 or sold@windermere.com.

Sources:

Seattle Real Estate Market Update – November 2014

The holidays are upon us and with the wintery weather we saw last month, it looks like several areas are seeing a temporary cooling off while people are focused on their holiday activities. This can spell a great opportunity for both buyers and sellers because the most serious of these are still in the market!

Buyers, if you have been waiting, trying to avoid competing, now might be your moment. Sellers, there ARE serious buyers out there which could spell opportunity. What should you keep your eyes open for this holiday season?

Inventory of Listings

Although the number of listings and the number of pendings has declined moving from October into November (which is normal for this time of year), it is interesting to note that the number of homes on the market has decreased looking at year over year number of listings. Comparing November 2014 and November 2013, the number of available listings has deceased in all five of the neighborhoods I track:

  • Central Seattle  -22.9%
  • Queen Anne -8.8%
  • Belltown  -8.3%
  • Ballard  -6.5%
  • North Seattle  -8.5%

Below is a table comparing the number of active listings (supply) and pendings (demand) for several of our Seattle neighborhoods (these numbers include single family residences as well as condos):

seattle-market-update-2014-nov-01

Median Sales Prices

Median sales prices have taken a slight step back in Central Seattle, Queen Anne/Magnolia, and Belltown looking at the year over year comparison between November of 2014 and 2013. If you look at the table above, specifically the ratio of active listings to pending listings, note that in the areas where the number of pendings is close to the number of active listings (such as North Seattle where the number of active listings is 118 whereas the number of pendings is 117) we aren’t seeing the price declines that some of the other areas see.

seattle-market-update-2014-nov-02

Please take time during this month to contact me at sold@windermere.com or give me a call: (206) 226-5300 to learn more and to receive my 2015 predictions for the real estate market!

Seattle Real Estate Market Update August 2014

Inventory of Listings

Below is a table comparing the number of active listings (supply) and pendings (demand) for several of the Seattle neighborhoods I specialize in: Central Seattle, Queen Anne / Magnolia, Belltown / Downtown, Ballard / Greenlake, and North Seattle.

market-update-aug-2014-01

The above includes residential and condos.

As you can see, inventory dropped dramatically in all the tracked neighborhoods. It is normal for a surge of properties to come on the market at the beginning of the summer with a good percentage pending by the end (indicative of the increase in pendings) which is one reason the inventory has decreased. However, the number of available listings in August this year versus last indicates that inventory is still below where it needs to be to keep up with demand as we head into fall. Please see the below table for the inventory comparison between this last August and 2013.

market-update-aug-2014-02

Median Sales Prices

Median Sales Price changes have continued their year-over-year increase in Central Seattle, Queen Anne/Magnolia, Ballard/Greenlake, and North Seattle year over year comparing August 2014 with August 2013. Belltown/Downtown did see a decrease. These prices are only looking at residential sales with the exception of Belltown which includes both residential and condos (since condos make up the bulk of the sales).

market-update-aug-2014-03

What does this fall look like for your property needs? Start planning now by giving me a call or sending an email: (206) 226-5300 or sold@windermere.com.

Seattle Real Estate Market Update July 2014

Inventory of Listings

Below is a table comparing the number of active listings (supply) and pendings (demand) for several of the Seattle neighborhoods I specialize in:

2014-jul-seattle-market-update01

If you are a seller or a buyer looking at the market, it is important to keep your eye on changes in inventory. I not only watch the market as a whole, but at individual home styles and price points also to keep on top of what is selling and how quickly so I can strategize with my clients.

Median Sales Prices

Median Sales Price changes have increased in Central Seattle, Queen Anne/Magnolia, Belltown/Downtown, Ballard/Greenlake, and North Seattle year over year comparing July 2014 with July 2013:

2014-jul-seattle-market-update02

We added a few more listings to our inventory in July which should cause the price appreciation speed to get back to the single digits. However, demand is still high. In fact, I currently have eleven listings and all of them are under contract but two.

In case you missed it, Seattle hit a milestone in July when we achieved a median sales price of $525,000 for residential sales. That surpassed the previous all-time high median sales price of $498,000 set in July of 2007.

You need an expert to keep up with the constant changes in this market. If you need information on your real estate investment, please contact me at sold@windermere.com or give me a call: (206) 226-5300.