Seattle Real Estate Market Update – Year to Date

I know I have been saying this now for a number of months, but the Seattle market has been off the charts! Instead of doing a month over month review, I wanted to take a look at the overall trends and compare how the real estate market is doing at the 2014 halfway point, comparing year-to-date residential and condominium data for 2011-2014. What I found is several areas are feeling the inventory pinch in a big way. Take a look at the summaries for the five areas I track below:

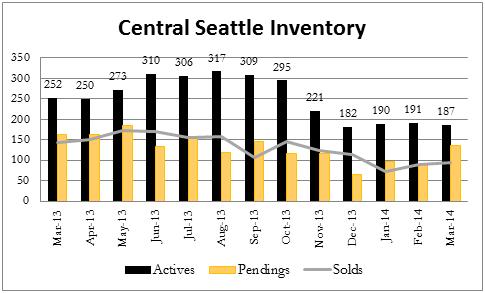
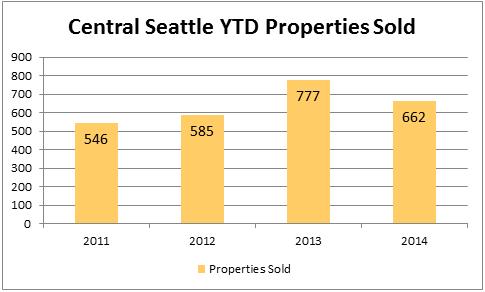
Central Seattle (Area 305)

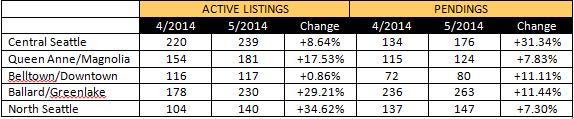
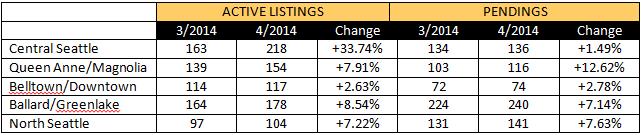
Central Seattle is feeling the inventory pinch, though not as bad as other areas. You can see our surplus of inventory in 2011 and how much it declined over 2012 and 2013. We have not seen much change between 2013 and 2014, other than the average inventory has declined by an average of about 12.5%.

2014-july-central-seattle-active-pending

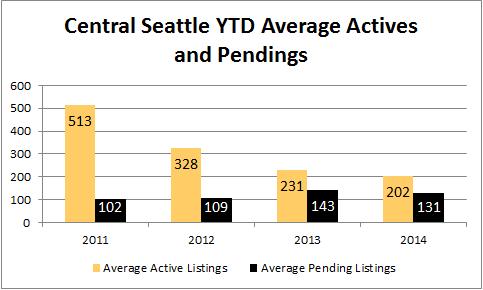
The number of solds increased dramatically in 2013 (+32.8%), but inventory challenges have caused 2014 to get off on a slower start.

2014-july-central-seattle-property-sold

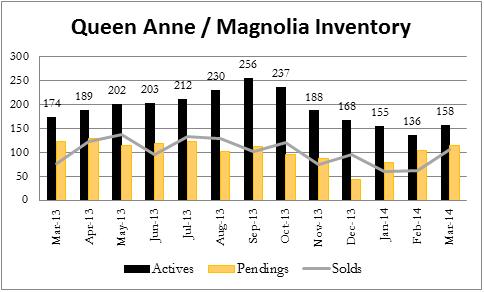
Queen Anne/Magnolia (Area 700)

Demand for homes is strong in these areas. Again, average inventory declined between 2011 and 2012 and has stayed about the same over 2013 and 2014. Average pendings are about the same as well, but you can see how close the pendings are to the inventory which indicates that demand is high.

2014-july-queen-anne-active-pending

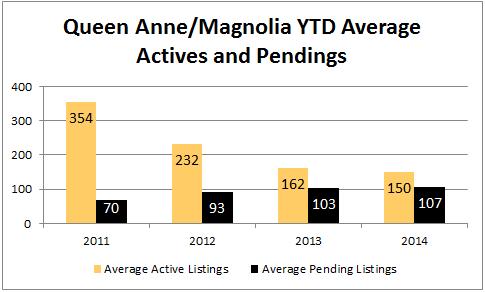
The number of solds over 2013 and 2014 have also been stable. These would likely be higher if more inventory was available.

2014-july-queen-anne-property-sold

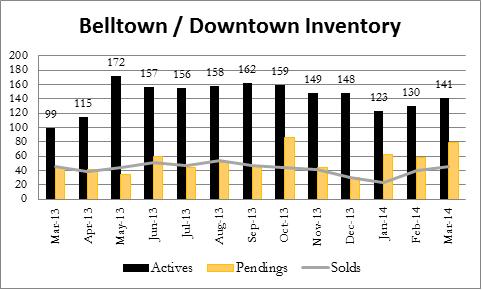
Belltown/Downtown (Area 701)

In 2011, housing demand in this area was the lowest among the five areas I evaluated, though not significantly so. This improved dramatically in 2012 but even more so in 2013 and 2014. Average inventory has improved in 2014, but only slightly. However, the average number of homes under contract have increased even more than the inventory has improved.

2014-july-belltown-active-pending

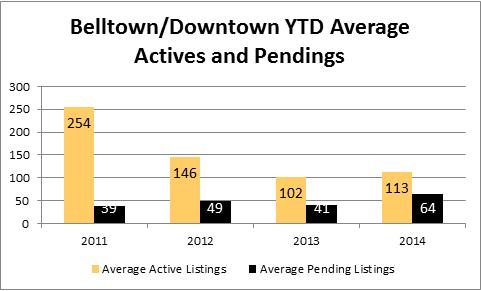
Accordingly, the number of sold properties has increased in 2014. However, we are not seeing a large increase in solds between 2011 through 2014 as we have in other areas.

2014-july-belltown-property-sold

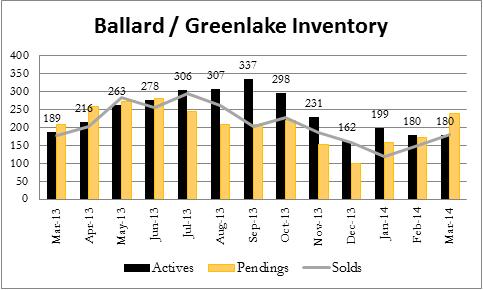
Ballard/Greenlake (Area 705)

Wow!  Inventory decreased dramatically between 2011 and 2012. 2013 and 2014 are about the same in terms of average active listings and pendings. What is interesting is the number of average pendings is higher in both years than the number of available listings. This is indicative of very high demand.

2014-july-ballard-active-pending

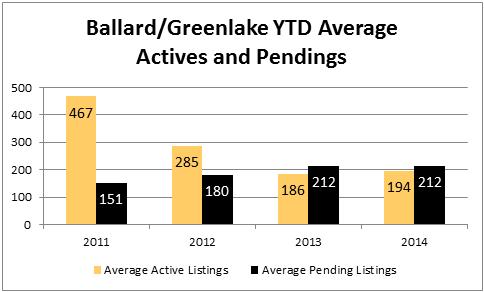
Solds are up slightly and would be even higher were there more inventory to purchase:

2014-july-ballard-property-sold

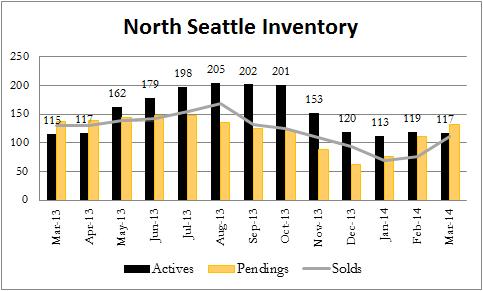
North Seattle (Area 710)

This is the most in-demand area at the moment with the average number of pendings the same as last year, but the average inventory has dropped 11.38% over last year. Again, we see a dramatic change between 2011 and 2012, but 2013 and 2014 have the highest demand.

2014-july-north-seattle-active-pending

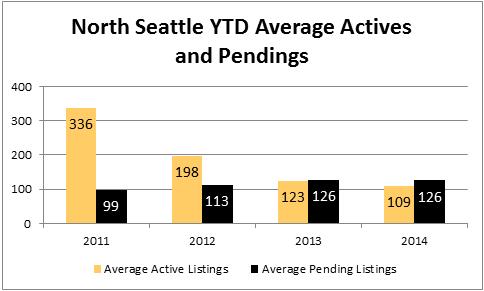
The number of solds has also increased, although this would be higher if more inventory was available.

2014-july-north-seattle-sold-property

Of the 12 listings I have at the moment, 8 of them are pending after being on the market an average of 11.88 days. What does this market mean for your real estate investment? Please give me a call at sold@windermere.com or give me a call: (206) 226-5300.

Seattle Real Estate Market Update May 2014

Throughout the city, the number of active listings are on the rise, but so are the homes under contract!
Below are some examples of properties that have closed in the last two weeks and and the list to sales price ratio indicates they may have sold for multiple offers:

may2014mu01

However, note that not all homes are selling for list price and for multiple offers! In fact, there are many homes in the MLS that have sold in the last 14 days that sold for 100% of list price or less. In the last two weeks, there have been 308 homes sold in Seattle and 103 condos. For the residences, 3 bedroom homes have commanded the highest list to sales price ratio of 103.66% while 5+ bedrooms are at an average of 99%.

Looking at condos, 4 bedroom condos were most in demand commanding an average list to sales price ratio of 100% (although there was technically only one sold).

Overall, the average list to sales price ratio for stand-alone residences is 102.45% while it is 99.73% for condos.
Therefore, if you are thinking of buying or selling, know that it is a competitive market and yes, some areas and price ranges are much more competitive than others. However, an agent who studies the market like I do will be able to provide you the information you need in order to make a great buying or selling decision.

Inventory of Listings

Below is a table comparing the number of active listings (supply) and pendings (demand) for several of our Seattle neighborhoods:

may2014mu02

Median Sales Prices

Median Sales Price changes have increased in all the below areas year over year comparing May 2014 with May 2013:

may2014mu03

You need an expert to keep up with the constant changes in this market. If you need information on your real estate investment, please contact me at sold@windermere.com or give me a call: (206) 226-5300.

Light Rail and It’s Impact on Seattle Real Estate

In the last few years, you may have noticed an increase in the number of listings and rentals that are touting the benefit of being in close proximity to a Sound Transit station. With demand in the city center driving real estate and rental prices up, buyers and renters are being forced to find housing further away from the city core. However, light rail is leading the charge in bringing people in from the outskirts into Seattle and people are expected to flock to areas surrounding the planned new stations in the coming years.

For example, when Sound Transit came to Tukwila a few years ago and the station near the airport opened, there was an uptick in real estate interest in the area surrounding it. Commuting via light rail from Tukwila only takes a little more than a half an hour according to the Seattle Times. In Tukwila the median sales price in April, 2014 was $205,000. In Seattle, the median sales price for the same period is $415,000*. It is much more affordable to live in outlying areas and simply commute in!

Developers, potential homeowners, and landlords are watching light rail plans very closely and are investing in areas where Light Rail will be connected. Here are just a few of the light rail projects in various planning stages which are targeted over the next several years according to www.soundtransit.org:

  • East Link Extension: There will be 10 stations along this route which will include Seattle, Mercer Island, Bellevue, Bel-Red, and Overlake in Redmond. This is expected to be completed in 2023.

  • Lynnwood Link Extension: This will link Lynnwood to Northgate. This is targeted for completion in 2023.

  • Northgate Link Extension: This will link Northgate, Roosevelt, and U District Neighborhoods to downtown Seattle and the airport. Ride time will be 14 minutes from Northgate to Downtown. It is expected to be completed in 2021.

  • University Link Extension: This will link the University of Washington and Capitol Hill to downtown Seattle and the airport. There will be two stations at UW and Capitol Hill. This project is expected to be complete in 2016.

So what does this mean for housing? Here is an example of how our market is impacted by Sound Transit’s transportation projects: University Manor Apartments near UW were recently snapped up by an investor who was very interested in the property due to its proximity to future Light Rail. The 80 unit apartment/commercial building received an amazing 14 offers. The new owner indicated that due to the amount of increased traffic in the area may call for converting the ground floor apartments back to retail. Rentals around Light Rail in the Puget Sound can command higher rent. Opportunities abound!

In addition to commuting via Light Rail for work, people are also opting to use Light Rail for traveling for recreation and events in Seattle. This helps avoid the headaches associated with battling traffic, and finding and paying for parking.

Homeowners, potential buyers, and investors should keep a close eye on opportunities surrounding planned Light Rail stations. For additional information on how our area’s transportation plans impact you, please contact me: (206) 226-5300 or sold@windermere.com.

Seattle Real Estate Market Update, April 2014

This spring market is very busy! As the spring goes on, there are more buyers in the market and we are starting to see “for sale” signs popping up on lawns throughout the city, closely followed by “sale pending” signs. How has the market changed since last month?

Inventory of Listings

The number of listings have increased in each of the Seattle areas since last month which is typical for a spring market. This increase has provided some relief for the strong demand, but pendings have also increased which shows that the demand is still very high. It is only when we see a trend of the number of active listings increasing without a corresponding pending increase that we will know that demand is waning.

Below is a table comparing the number of active listings (supply) and pendings (demand) for several of our Seattle neighborhoods:

inventory-april2014

You may note in the above that Central Seattle’s inventory grew the most and didn’t see a matching growth in pendings as of the end of April. It is apparent that sellers recognize the opportunity that exists in the market right now and have decided to take advantage of that. With the increased number of buyers in the market, I expect to see the number of pendings to increase in Central Seattle next month.

Furthermore, take a look at Queen Anne / Magnolia where the inventory has increased by 7.91% but pendings have increased by 12.62%. This shows us that demand in this area is particularly high.

Median Sales Prices

Median Sales Price changes have increased in all the below areas year over year comparing April 2014 with April 2013 as well.

median-sales-april2014

You need an expert to keep up with the constant changes in this market. If you need information on your real estate investment, please contact me at sold@windermere.com or give me a call: (206) 226-5300.

Seattle Real Estate Market Update March 2014

In the month of March there were 797 ACTIVE listings in Seattle. In the month of March 736 homes went PENDING. This means that 1 out of every 1.1 homes on the market went SOLD PENDING.
This implies a 1.1 month supply of inventory.

  • Any ratio under 3.0 is considered a “seller’s market indicator”
  • Any ratio between 3.1 to 6.0 is considered a “neutral market indicator”
  • Any ratio over 6.1 is considered a “buyer’s market indicator”

The Seattle inventory ratios for the last twelve months are as follows:

march2014seattle-market-numbers

In fact, the last 26 months (February 2012 through March 2014) have all had seller’s market indicators!
Another way to look at inventory is the number of homes available for sale. In March 2014, there were 797 active listings available for sale. The 10 year moving average for the number of active listings available in March is 1,704. Therefore we are 53% below our 10 year moving average for Seattle housing inventory.
Inventory continues to be a challenge in the Seattle area. As you can see in the graphs below, in most areas, supply cannot keep up with demand. I expect these conditions will continue until we have enough homes available for the number of buyers who are in the market.

mar2014-seattle-north

mar2014-seattle-ballard

belltown ballard

mar2014-central-seattle

Median Sales Prices
The Seattle housing market peaked in July of 2007 with a median sales price of $496,000. The median home price of a Seattle home in March 2014 is $441,000. Therefore the average price of a Seattle home has come down 11% since we peaked in July of 2007.

Median Sales Prices in most areas have risen along with the high demand. However, due to lack of inventory in certain price points, median sales prices in some areas have seen a decline because there are simply not enough homes available at higher price points.

2014-2013-march-comparison

If you have been wondering how your home fits in the market or would like additional data or information, please contact me. I would be happy to look at the numbers for your neighborhood and let you know where you stand with your real estate investment. Please contact me at sold@windermere.com or give me a call: (206) 226-5300.