The holidays are upon us and with the wintery weather we saw last month, it looks like several areas are seeing a temporary cooling off while people are focused on their holiday activities. This can spell a great opportunity for both buyers and sellers because the most serious of these are still in the market!
Buyers, if you have been waiting, trying to avoid competing, now might be your moment. Sellers, there ARE serious buyers out there which could spell opportunity. What should you keep your eyes open for this holiday season?
Inventory of Listings
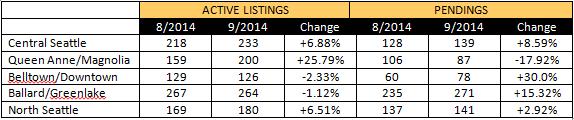
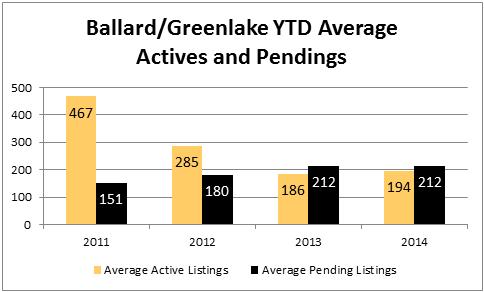
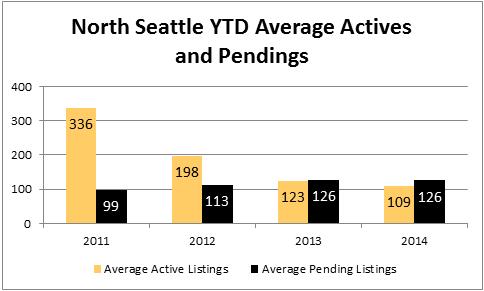
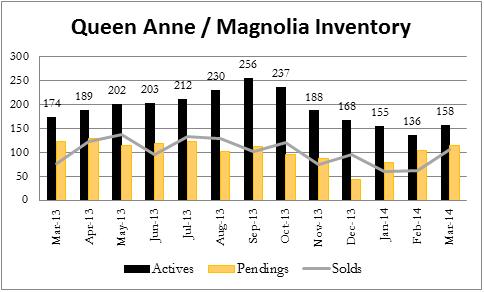
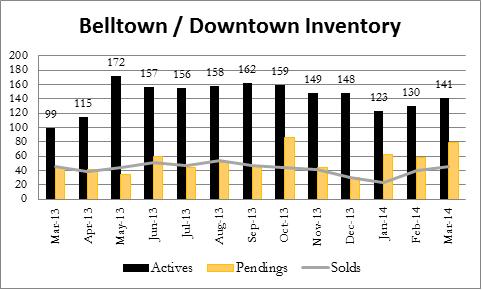
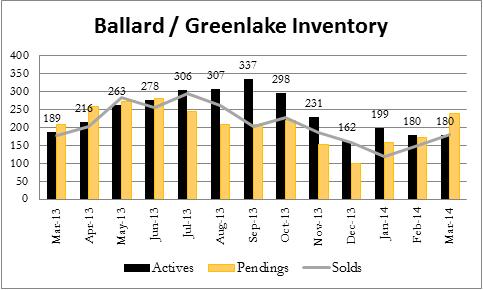
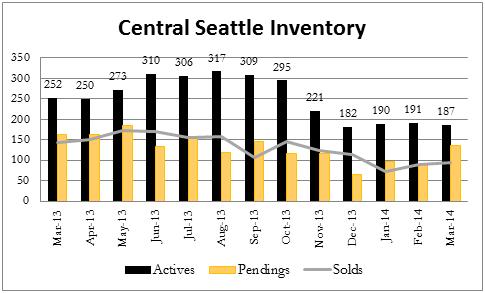
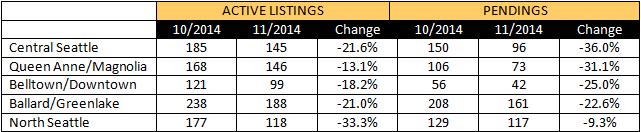
Although the number of listings and the number of pendings has declined moving from October into November (which is normal for this time of year), it is interesting to note that the number of homes on the market has decreased looking at year over year number of listings. Comparing November 2014 and November 2013, the number of available listings has deceased in all five of the neighborhoods I track:
- Central Seattle -22.9%
- Queen Anne -8.8%
- Belltown -8.3%
- Ballard -6.5%
- North Seattle -8.5%
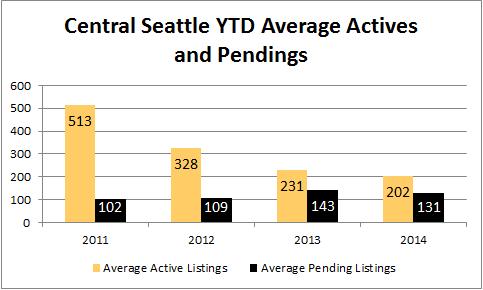
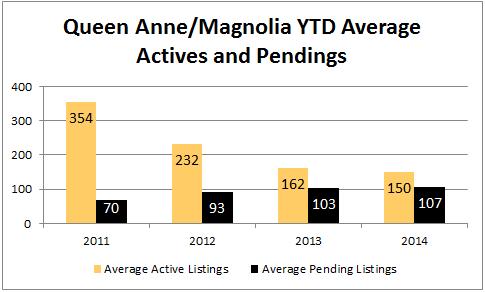
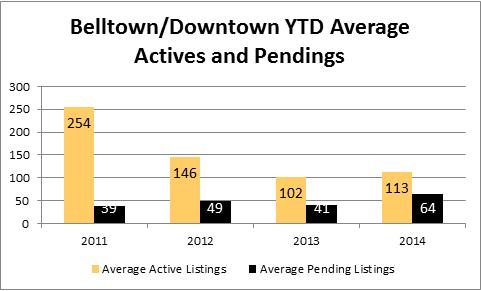
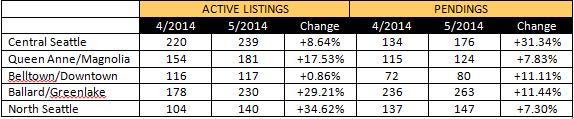
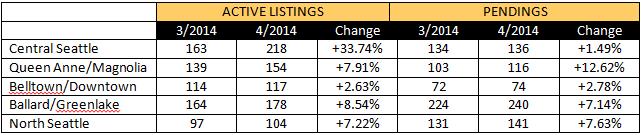
Below is a table comparing the number of active listings (supply) and pendings (demand) for several of our Seattle neighborhoods (these numbers include single family residences as well as condos):
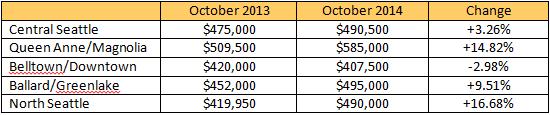
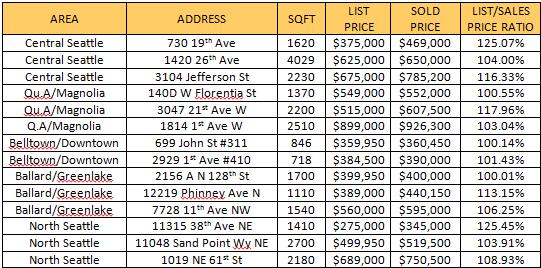
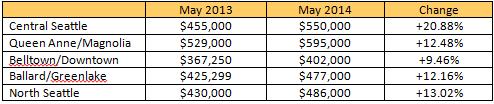
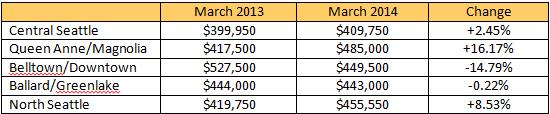
Median Sales Prices
Median sales prices have taken a slight step back in Central Seattle, Queen Anne/Magnolia, and Belltown looking at the year over year comparison between November of 2014 and 2013. If you look at the table above, specifically the ratio of active listings to pending listings, note that in the areas where the number of pendings is close to the number of active listings (such as North Seattle where the number of active listings is 118 whereas the number of pendings is 117) we aren’t seeing the price declines that some of the other areas see.

Please take time during this month to contact me at sold@windermere.com or give me a call: (206) 226-5300 to learn more and to receive my 2015 predictions for the real estate market!